A glass fiber reinforced engineering plastic plant turns commodity resin into a higher-value compound, and the gap between resin cost and compound selling price is what pays back the investment. Forecasting the payback cycle of a twin screw compounding plant is less about a single magic number and more about understanding the levers: throughput, fiber loading, operating cost, and line uptime. Kerke, a Wanplas factory with 12 plus years in twin-screw compounding extruders, has placed more than 2,000 machines in over 70 countries from a 19,997 plus square meter base. This guide builds a payback forecast framework you can apply to a Kerke KTE line before you commit capital, using relative cost tiers and capacity bands rather than fixed price quotes, so the logic travels across regions and currencies.
The discipline of a good forecast is separating what you control from what you assume. You control the line size, the configuration, and the operating discipline. You assume the spread, the sales ramp, and the energy rate. A forecast that confuses the two either over-promises or buries a weak case in detail. The structure below keeps the controllable inputs visible so you can defend the number to a finance team.
What shapes the payback cycle of a glass fiber compounding plant
The payback cycle measures how long the cumulative profit from the plant takes to recover the total invested capital. In a twin screw compounding plant, four levers dominate. The first is nameplate utilization: a line running at 60 percent of rated output pays back far slower than the same line at 90 percent, because fixed costs spread over fewer sold tons and the conversion cost per ton rises.
The second lever is the value-added spread, the difference between the resin plus glass fiber plus additive cost and the compound selling price. Glass fiber engineering plastics such as reinforced PA, PBT, and PP carry a meaningful spread, but the spread narrows as fiber loading rises and as the grade becomes commoditized. Product mix planning therefore moves payback more than most buyers expect, and it is the first input to model carefully.
The third lever is operating cost, especially energy and labor. A co-rotating parallel twin-screw line is energy-intensive at the barrel and gearbox, so drive efficiency and cooling loop design matter. Labor scales with automation: a loss-in-weight feeder and centralized control cut the operator count versus manual batch weighing, which compounds across every sold ton.
The fourth lever is uptime and yield. Screw wear, screen changer stops, and pelletizing defects cut salable output and raise scrap. A plant that loses 15 percent of runtime to stops doubles its effective payback period versus a well-tuned line. Kerke’s self-cleaning kneading screw design and pre-shipment 72-hour test target this lever directly by reducing unplanned stops and start-up scrap.
Capital cost structure in relative tiers
Total invested capital for a glass fiber compounding plant spans more than the extruder. The line itself is one block; the building, utilities, material handling, lab, and commissioning form the rest. Expressing capital in relative tiers keeps the forecast portable across regions and currencies while still showing the structure that a finance reviewer needs to see.
The main extruder and pelletizing system typically represent a Medium to High share of the equipment budget. The building and civil works represent a Medium share that rises with the clear height and dust extraction needed for glass fiber. Utilities, including the water chiller, dust collector, and electrical supply, form a Low to Medium share that grows for large lines with heavier cooling and extraction loads.
Auxiliary equipment such as the high-speed mixer, loss-in-weight feeders, vacuum conveying, and bagging station add a Medium share, and the quality lab plus commissioning add a Low share. The table below maps these blocks to relative tiers so you can sanity-check a detailed quote against the expected shape before you sign.
| Capital block | Small line | Medium line | Large line |
|---|---|---|---|
| Extruder plus pelletizer | Medium | High | Very High |
| Building and civil works | Medium | Medium | High |
| Utilities and extraction | Low | Medium | High |
| Auxiliary and conveying | Medium | Medium | High |
| Lab and commissioning | Low | Low | Medium |
Notice that capital does not scale linearly with output. A large line costs more than a small line but delivers far more tons per year, so the capital per annual ton often falls as you move up the tiers. That scaling is the single biggest reason payback can improve at higher capacity, provided the larger volume is actually sold and not parked in inventory.
Because this guide avoids fixed price quotes, treat the tiers as a checklist: if a vendor quote shows the building as the dominant cost on a small line, or the extruder as trivial on a large line, the estimate deserves a second look. The relative shape is a powerful sanity filter that catches mis-scoped projects before capital is committed.
Output capacity as the revenue driver
Revenue in a compounding plant is output times spread, so throughput is the strongest payback lever after utilization. Kerke’s KTE co-rotating parallel twin-screw series spans 30 kg/h in the laboratory up to several tons per hour on the KTE-135D, letting you match the line to a realistic sales plan rather than over-building capacity you cannot sell.
Convert the hourly output into an annual tonnage using a realistic operating schedule. A plant running 24 hours with planned maintenance and changeovers might achieve 6,000 to 7,500 effective hours per year, while a single-shift plant achieves far less. The same machine therefore supports very different annual tonnages and very different payback outcomes, which is why the shift plan belongs in the forecast.
Glass fiber loading also matters. A 30 percent glass fiber PA66 compound uses more fiber per ton than a 15 percent grade, raising raw material cost but also raising the value-added spread when the compound is sold on performance. The forecast must model fiber loading per the target product, not a generic average, because loading changes both cost and price.
The table below expresses annual tonnage bands for common KTE sizes at a multi-shift schedule. These bands feed the payback model in later sections; adjust the effective hours to your own shift plan before drawing conclusions, and remember that year one rarely reaches steady state.
| Kerke model | Output (kg/h) | Annual tons (multi-shift) | Typical glass fiber grade |
|---|---|---|---|
| KTE-36 | 80-200 | 500-1,400 | Reinforced PP, PA small lots |
| KTE-72 | 500-1200 | 3,000-8,500 | GFR PA, PBT, ABS |
| KTE-95 | 1200-2800 | 7,000-19,000 | GFR engineering plastics |
| KTE-135D | 3000-6500 | 18,000-45,000 | High-volume GFR compounds |
For a payback forecast, pair each tonnage band with a realistic sell-through rate. A new plant rarely sells at full nameplate in year one, so the model should ramp output from a conservative first-year figure toward the steady-state band over two to three years. The ramp shape changes the cumulative payback point more than the steady-state number alone, and it is where optimistic plans quietly fail.
Also separate capacity from salable volume. A line may make 10,000 tons a year, but if the market absorbs only 6,000 at the target spread, the extra 4,000 either sits in inventory or sells at a discount. Model salable volume, not theoretical capacity, and the payback will reflect reality instead of a brochure.
Operating cost components by relative tier
Operating cost subtracts from the value-added spread every month, so it directly lengthens or shortens payback. The main components are raw material, energy, labor, maintenance and spare parts, and overhead. Raw material is by far the largest, but it is also recovered in the selling price, so the lever that matters for payback is the conversion cost: energy, labor, and maintenance.
Energy scales with screw diameter and motor power. A larger KTE line draws more total power but often less power per ton because of better specific energy at scale, so energy cost per ton can fall on bigger lines. Cooling loop efficiency, driven by the water chiller and barrel temperature control, is where many plants leak savings through oversized pumps and poor insulation.
Labor scales inversely with automation. A line with loss-in-weight feeders, centralized PLC control, and automated bagging needs fewer operators per ton than a manually weighed batch line. The table below maps conversion cost components to relative tiers by line size, giving a structure to plug your local rates into and to compare candidate configurations on a level basis.
| Conversion cost | Small line | Medium line | Large line |
|---|---|---|---|
| Energy per ton | Medium | Medium | Low |
| Labor per ton | High | Medium | Low |
| Maintenance per ton | Medium | Medium | Medium |
| Overhead per ton | High | Medium | Low |
Maintenance deserves special attention in glass fiber service. Glass fiber is abrasive to barrel and screw elements, so wear parts turn over faster than in filler-only lines. Budget the screw element and barrel liner replacement cycle into the forecast, and use the Wanplas group USD 500 free parts every year allowance to offset early wear items within warranty, which flattens the cost curve in the first operating years.
The takeaway is that bigger, automated lines usually carry lower conversion cost per ton, which compresses payback even when capital is higher. The forecast should never compare only the sticker of the machine; it should compare the delivered cost per sold ton across the candidate configurations, because that is the number that actually drives the return.
Overhead is easy to forget and important at small scale. A pilot line still needs a quality lab, a supervisor, and insurance, and those fixed costs sit on few tons, pushing cost per ton high. The small line can still pay back quickly on a high-spread niche grade, but only if the spread is genuinely premium and the volume is reliably sold.
Kerke KTE line for engineering plastics
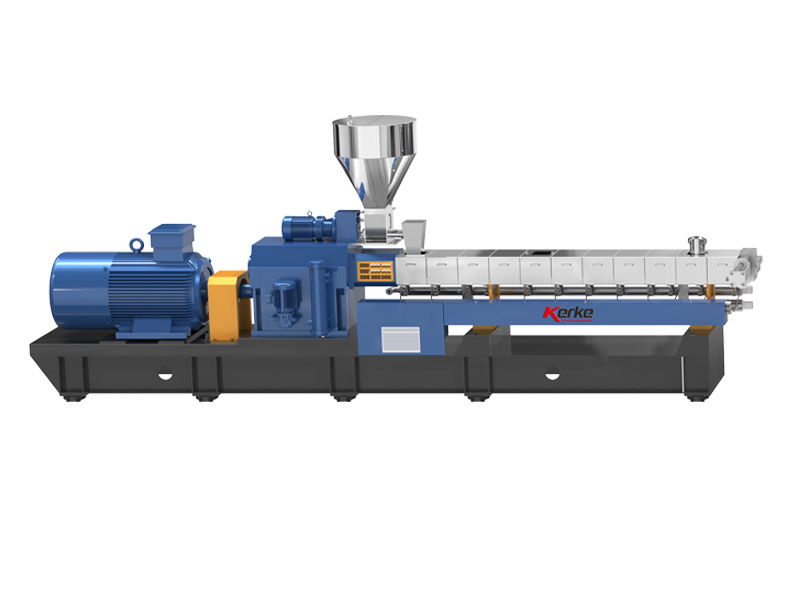
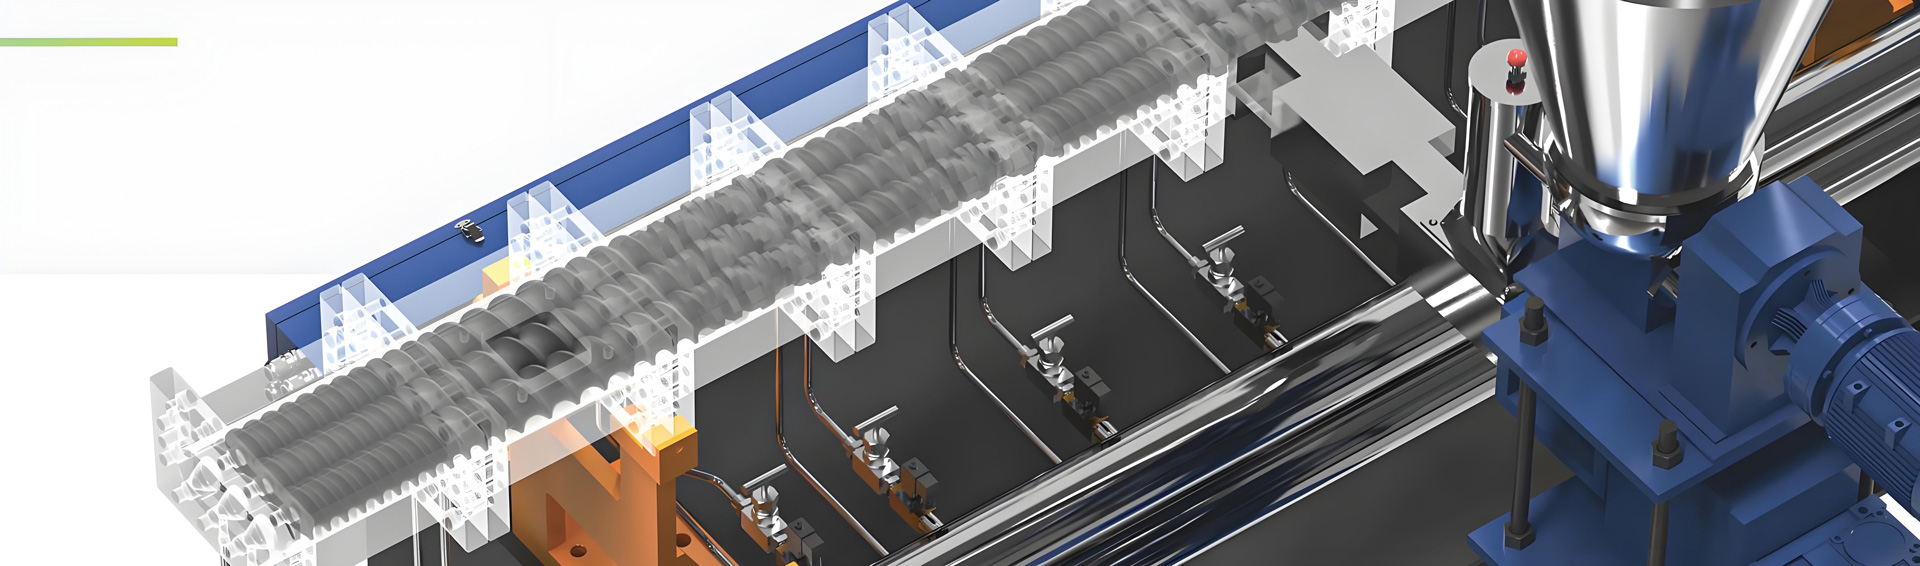
For glass fiber engineering plastics, Kerke recommends the KTE co-rotating parallel twin-screw series with a screw layout tuned for the target fiber and resin. The computer-aided screw assembly uses a kneading co-type profile with excellent self-cleaning and interchangeability, so one barrel runs reinforced PA, PBT, or ABS by swapping screw elements rather than rebuilding the line, which protects flexibility as the product mix shifts.
The specification table below shows representative KTE models for engineering plastic compounding. Output ranges reflect typical glass fiber reinforced grades; actual figures depend on fiber loading, melt viscosity, and L/D ratio, all of which Kerke optimizes per recipe during the layout review so the forecast uses commissioned performance rather than a catalog maximum.
| Model | Screw Ø (mm) | L/D | Output (kg/h) | Drive power (kW) | Typical use |
|---|---|---|---|---|---|
| KTE-52 | 52 | 40-44 | 200-500 | 55-90 | Pilot and small GFR lots |
| KTE-72 | 72 | 40-48 | 500-1200 | 132-220 | GFR PA, PBT, ABS |
| KTE-95 | 95 | 40-52 | 1200-2800 | 315-550 | High-volume engineering plastic |
| KTE-135D | 135 | 44-52 | 3000-6500 | 900-1600 | Dedicated GFR compound plant |
Kerke optimizes the aspect ratio, barrel structure, screw arrangement, exhaust, feeding, and electrical control for each application, so the same model number serves very different recipes. For engineering plastics that need devolatilization after glass fiber addition, the L/D is extended and a vent section is placed downstream of the side feeder to strip trapped volatiles without disturbing fiber distribution.
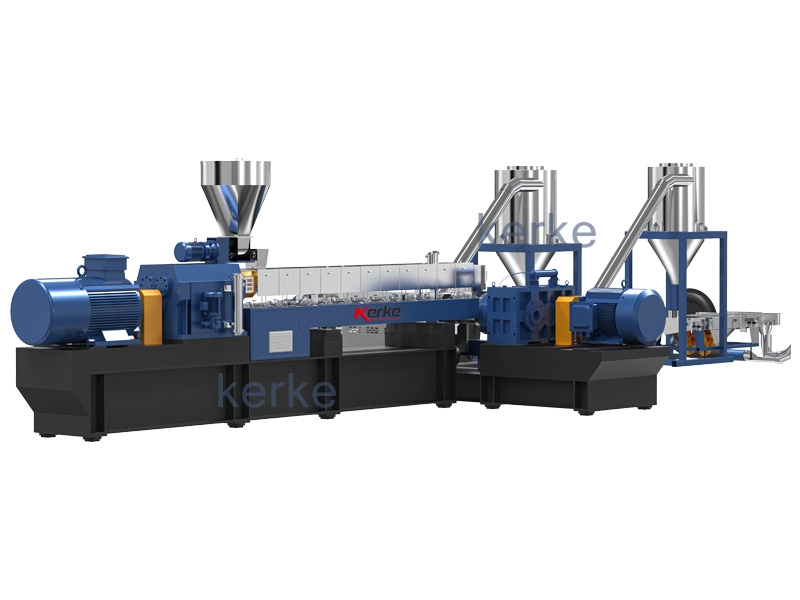
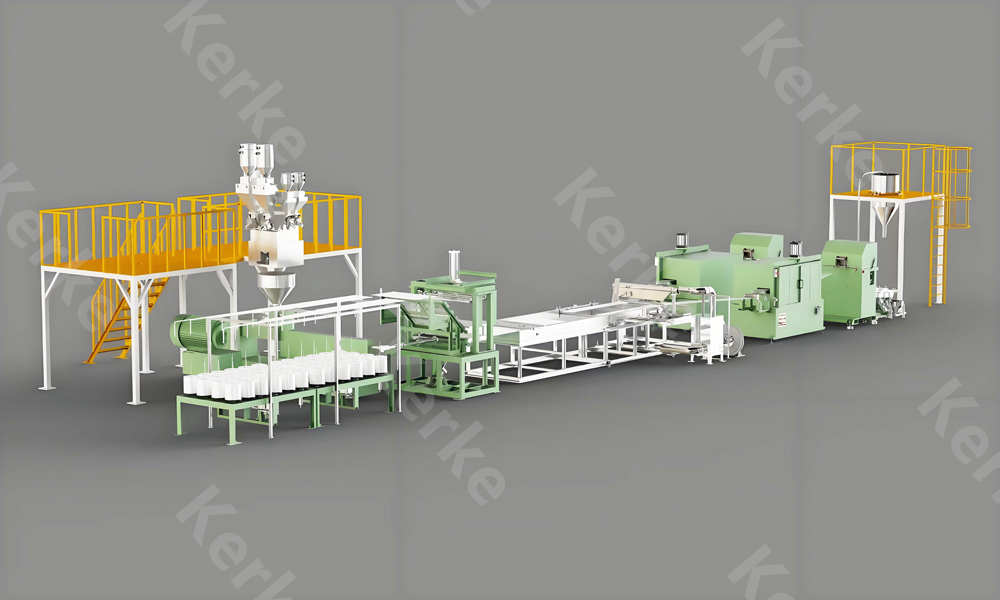
The KTE line integrates directly with Kerke’s pelletizing systems, including water ring die face hot cutting and underwater pelletizing that suit dusty glass fiber grades. A matched line from one supplier simplifies commissioning, spare parts, and the payback forecast because the interfaces are proven rather than improvised, and a single warranty removes the finger-pointing that delays a multi-vendor startup.
Because the screw is element-based, the same KTE-95 can later be reconfigured for a new glass fiber grade by changing only the kneading and conveying elements, not the machine. That adaptability is a quiet hedge in the payback case: the capital stays productive as the market moves, instead of becoming obsolete when the first grade matures.
Double-stage and side feeder configuration
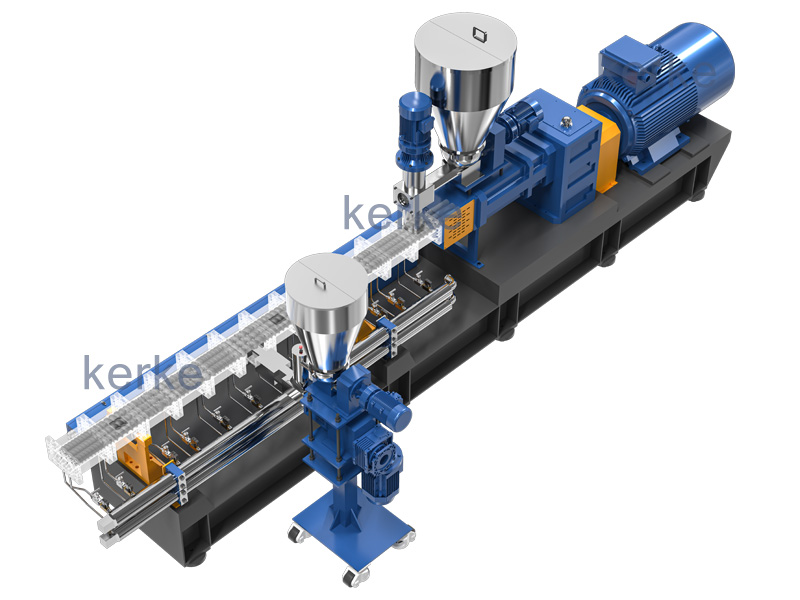
Glass fiber engineering plastic lines almost always use a side feeder for the fiber, and many use a double-stage mother-baby system for difficult grades. The side feeder introduces chopped strand or roving into the melting zone under gravimetric control, protecting fiber length and keeping the feed throat clear for resin and filler, which protects both quality and the value-added spread.
The double-stage extrusion system splits melting and devolatilization across two screws. The first stage plasticizes and disperses; the second stage builds pressure and strips volatiles. This configuration improves quality for heat-sensitive or highly filled GFR grades and reduces degradation, which protects the value-added spread that drives payback and reduces customer rejects that destroy margin.
The configuration table below maps feeding and staging options to the resulting line character. Adding a second side feeder for filler, or moving to a double-stage system, raises capital and footprint but can raise yield and selling price enough to shorten payback for the right product, so the choice is a financial one, not just technical.
| Configuration | Fiber entry | Staging | Quality effect | Capital effect |
|---|---|---|---|---|
| Single-stage, side feeder | One side feeder | Single | Good | Medium |
| Twin side feeder | Fiber plus filler | Single | Good to high | Medium-High |
| Double-stage | One or twin | Mother-baby | High | High |
| Double-stage plus twin feeder | Fiber plus filler | Mother-baby | Very high | Very High |
Kerke supplies the loss-in-weight feeder, crammer feeder for fluffy regrind, and liquid feeder for coupling agents as part of the configuration. The right selection depends on whether the grade is short or long glass fiber, filled or unfilled, and whether coupling agent is added as a melt stream. Define the recipe before fixing the configuration, because the wrong feeder choice quietly erodes payback through scrap and rework.
A practical rule is to specify the configuration for the hardest grade in your planned mix, then run the easier grades on the same line. Over-specifying the feeder and staging costs capital once, while under-specifying costs scrap and lost sales on every difficult order. The forecast should test both the easy and hard grade through the same line before settling the configuration.
Recommended model and payback by capacity tier
Bringing the levers together, the table below pairs each capacity tier with a recommended Kerke model, a typical annual tonnage band, and a relative payback indicator. The payback indicator is a planning band expressed in months of operation at steady state, not a fixed quote, and assumes a realistic utilization ramp and a normal engineering plastic spread rather than a best-case scenario.
The relative payback band tightens as capacity rises because capital per ton falls and conversion cost per ton falls, provided the larger volume is sold. A small line can still pay back quickly if it serves a high-spread niche grade with full utilization, while a large line lags if half its output goes unsold or sits in inventory at a discount.
| Capacity tier | Kerke model | Annual tons | Relative payback band |
|---|---|---|---|
| Small | KTE-52 | 500-3,000 | Medium |
| Medium | KTE-72 to KTE-95 | 3,000-19,000 | Medium to short |
| Large | KTE-110 to KTE-135D | 18,000-45,000 | Short to medium |
| Niche pilot | KTE-36 | 200-1,400 | Medium to long |
Interpreting the bands: a “short” relative payback means the plant recovers capital within roughly 18 to 30 months of steady-state operation; “medium” means about 30 to 42 months; “long” means beyond 42 months. These are planning indicators derived from throughput and conversion cost structure, not a promise of a specific return, and they assume the sold volume matches the tier rather than merely the installed capacity.
To turn the band into a number for your case, multiply annual tons by the value-added spread per ton, subtract annual conversion cost, and divide the total capital by the resulting annual free cash flow. The framework above gives every input except your local spread and rates, which only you can supply. Kerke’s layout review helps you lock the throughput and configuration side of the equation so the model rests on commissioned performance.
Run the calculation at three spread scenarios: conservative, base, and strong. If even the conservative case recovers capital inside your hurdle period, the project is robust; if only the strong case works, the plan is a bet on price that deserves a smaller, more flexible line such as a KTE-72 that can be upgraded rather than a KTE-135D committed on hope.
Sensitivity factors that move the payback
A payback forecast is only as useful as its sensitivity analysis. Small changes in a few inputs swing the result more than buyers expect, so the table below lists the factors and the direction they move payback when they shift unfavorably, ranked so you know where to spend management attention.
Utilization is the most sensitive. Dropping from 90 percent to 60 percent effective runtime roughly doubles the time to recover capital because fixed cost per ton rises while output falls. Product mix is next: shifting from a high-spread reinforced grade to a commoditized one compresses the value-added spread and lengthens payback even at full output, because the revenue side collapses while the cost side barely moves.
Energy price and labor rate move conversion cost, but their effect is smaller than utilization for most plants because raw material dominates the total. Screw wear from glass fiber abrasion is a hidden sensitivity: faster element replacement raises maintenance and can force unplanned stops that cut utilization at the worst moment, coupling two levers into one failure.
| Sensitivity factor | Direction if worse | Relative impact on payback |
|---|---|---|
| Utilization drop | Lower runtime | Very High |
| Product spread drop | Commoditized grade | High |
| Energy price rise | Higher power cost | Medium |
| Faster screw wear | More stops | Medium-High |
| Slower sales ramp | Lower year-one tons | High |
The practical response is to protect utilization first. Choose a line size matched to a defensible sales plan rather than the largest available, and invest in automation that stabilizes runtime. Kerke’s remote monitoring and pre-shipment 72-hour test directly support utilization, which is why they belong in the payback discussion, not just the spec sheet, and why they should be costed as payback protection.
Application industries for glass fiber engineering plastics
Glass fiber reinforced engineering plastics made on a Kerke KTE line serve industries where stiffness, heat resistance, and dimensional stability matter more than raw material cost. Each end market sets the product spec, the batch size, and the quality documentation, all of which feed the payback forecast through price and volume rather than through the machine alone.
Automotive is the largest destination, using glass fiber reinforced PA and PBT for under-hood parts, brackets, and connector housings where metal replacement saves weight. These grades command a healthy spread but demand tight fiber length and consistent color, so the quality lab and changeover discipline must be built into the operating cost assumption rather than treated as free.
Electrical and electronics use glass fiber reinforced thermoplastics for connectors, switchgear, and housings needing flame retardancy and tracking resistance. Cable compounding, a related Kerke application, adds halogen-free flame-retardant and filler masterbatches that are often heavily filled, raising feeder count and wear, which the maintenance budget must reflect.
Consumer durables and appliances use reinforced ABS and PP for structural parts, while power tool housings and garden equipment favor glass fiber compounds for impact strength. These markets are price-sensitive, so the forecast should use a more modest spread and lean harder on utilization and conversion cost control to keep payback inside the hurdle.
| End market | Typical compound | Spread level | Volume pattern |
|---|---|---|---|
| Automotive | GFR PA, PBT | High | Large, steady |
| Electrical and cable | GFR thermoplastic, HFFR | Medium-High | Large |
| Appliances and durables | GFR ABS, PP | Medium | Medium |
| Industrial and niche | Specialty GFR | Very High | Small, premium |
The pattern is clear: high-volume automotive and cable grades reward large, automated lines with short payback, while specialty industrial grades reward small, flexible lines serving a premium spread. Match the Kerke model to the market you can actually win, not to the largest line you can finance, and the application mix becomes the strongest support for the payback case.
Risk and mitigation in the forecast
Every payback forecast carries risk, and naming it is better than hiding it. The first risk is the sales ramp: a new plant rarely sells at nameplate immediately, so the model should assume a conservative first-year volume and a multi-year climb. Overstating year-one tons is the most common way a forecast looks attractive and then disappoints the finance team that approved it.
The second risk is recipe failure. A glass fiber grade that strands poorly, plates the die, or scatters fiber in the pellet can wreck yield. Mitigation is to run customer material on a Kerke line during the open-factory visit and confirm the screw and pelletizing configuration before purchase, turning a forecast assumption into a demonstrated result that the model can rely on.
The third risk is abrasion-driven downtime. Glass fiber wears barrels and screws faster than unfilled compounds, so mitigation is a planned wear-part budget, spare screw elements on hand, and the Wanplas USD 500 free parts every year policy that offsets early replacement within warranty. Treat wear as a scheduled cost, not a surprise, and the sensitivity on utilization stays under control.
The fourth risk is scope creep in the building. Adding dust extraction, extra clear height, or a second line later is far costlier than planning for it. Mitigation is to size the workshop using the capacity tier method and reserve a 25 to 35 percent area premium if a second line is likely within three years, protecting both the space and the capital plan.
The fifth risk is supplier fragmentation. A line bought from multiple vendors can stall in interface disputes during startup, delaying the sales ramp exactly when the forecast needs volume. Choosing a matched Kerke line with one warranty removes that risk and is a legitimate payback protection, not merely a convenience, because delayed startup is delayed cash recovery.
Kerke service and support
A payback forecast depends on the line running as modeled, so the support package is part of the financial case. As a Wanplas factory, Kerke applies the group’s shared promises: a 72-hour continuous operation test before shipment, engineer-led installation and commissioning, and the Wanplas USD 500 free parts every year allowance with free replacement of damaged parts within warranty, all of which protect uptime and the early cash flow.
Kerke offers layout review and 3D workshop design that lock the throughput and utility loads used in the forecast, plus recipe testing on customer material so the assumed yield becomes a measured result. Training covers screw assembly, side feeder and loss-in-weight feeder calibration, and pelletizing adjustment to keep utilization high after handover, which is exactly the lever that dominates payback.
Remote monitoring lets Kerke engineers read PLC data and advise on tuning, shortening the learning curve that otherwise delays the sales ramp and lengthens payback. The open-factory policy invites customers to the 19,997 plus square meter base to witness a running glass fiber line and confirm the process before committing capital, de-risking the single biggest assumption in the model.
Spare parts for barrels, screw elements, side feeders, and pelletizer blades are stocked against the KTE model list, and the shared free parts allowance reduces early wear-item cost in the first years of glass fiber service. Combined with more than 2,000 machines running in over 70 countries, the support structure is a measurable input to the payback timeline and a reason the forecast can assume a credible utilization from year two onward.
Frequently Asked Questions
What is the strongest payback lever?
Utilization is the strongest lever. A line at 90 percent effective runtime pays back roughly twice as fast as the same line at 60 percent, because fixed cost per ton falls and output rises. Protect runtime with automation and planned maintenance before chasing a bigger machine, and monitor it monthly after startup.
Do larger lines pay back faster?
Usually yes, because capital per annual ton and conversion cost per ton both fall at scale, provided the larger volume is actually sold. A large line with unsold capacity lags a small line running at full utilization on a high-spread niche grade, so match the model to the market you can win.
How does glass fiber affect operating cost?
Glass fiber is abrasive, so barrels and screw elements wear faster than in unfilled lines, raising maintenance and stop risk. Budget a planned wear-part cycle and use the Wanplas USD 500 free parts every year allowance to offset early replacement within warranty, treating wear as scheduled cost rather than a surprise.
Which Kerke model fits a medium plant?
A medium glass fiber engineering plastic plant typically uses the KTE-72 to KTE-95, covering roughly 3,000 to 19,000 annual tons at multi-shift operation. The exact model depends on fiber loading, resin viscosity, and the required L/D for devolatilization after glass fiber addition.
Why use a side feeder for glass fiber?
A side feeder introduces glass fiber into the melting zone after the resin has melted, protecting fiber length and metering the rate precisely. Feeding fiber at the main hopper over-cuts it into powder and wastes reinforcement, lowering the compound value and the payback at the same time.
Should I plan a double-stage system?
Choose a double-stage mother-baby system for heat-sensitive or highly filled glass fiber grades that need separated melting and devolatilization. It raises capital and footprint but can lift yield and selling price enough to shorten payback for the right product, so test it in the forecast before deciding.
Can Kerke verify the forecast assumptions?
Kerke runs recipe testing on customer material during the open-factory visit and supplies layout review with 3D design and utility loads, turning assumed throughput and yield into demonstrated results that feed a more reliable payback model and reduce the biggest risks in the plan.
Conclusion
Forecasting the payback cycle of a glass fiber engineering plastic twin screw compounding plant is a structure problem before it is a number problem. Start with a defensible sales plan and utilization ramp, then size the Kerke KTE line to that plan rather than to the largest catalog model. Model the value-added spread per ton, subtract the conversion cost shaped by energy, labor, and glass fiber wear, and divide total capital by the resulting annual free cash flow, testing conservative, base, and strong spread cases.
The framework here shows why utilization and product mix dominate, why larger automated lines often shorten payback through lower cost per ton, and why a side feeder and, where needed, a double-stage system protect the yield that the financial case depends on. Kerke, a Wanplas factory with 12 plus years and a 19,997 plus square meter base, builds the KTE co-rotating parallel twin-screw series from KTE-36 to KTE-135D with a self-cleaning kneading screw and matched pelletizing. Share your target grade, fiber loading, and annual volume, and the Kerke team will return a configured line, a layout, and the throughput inputs your payback model needs to stand up to scrutiny.