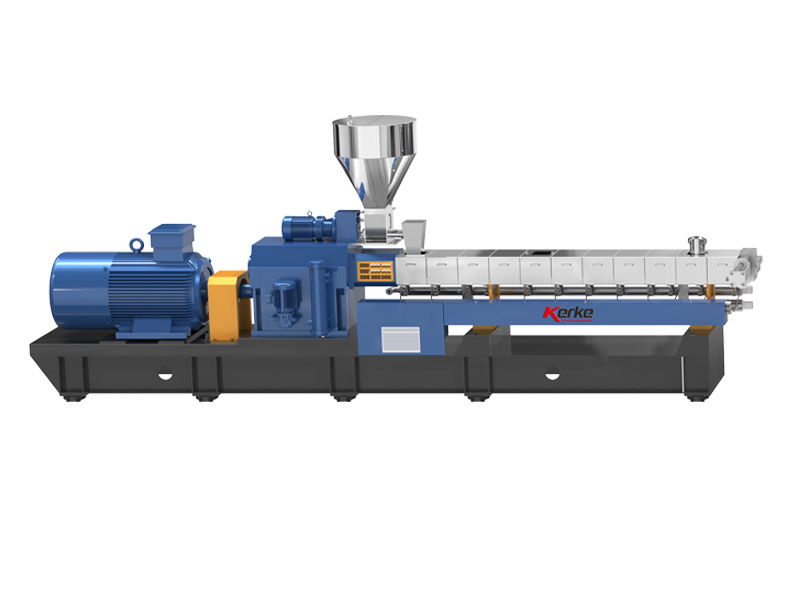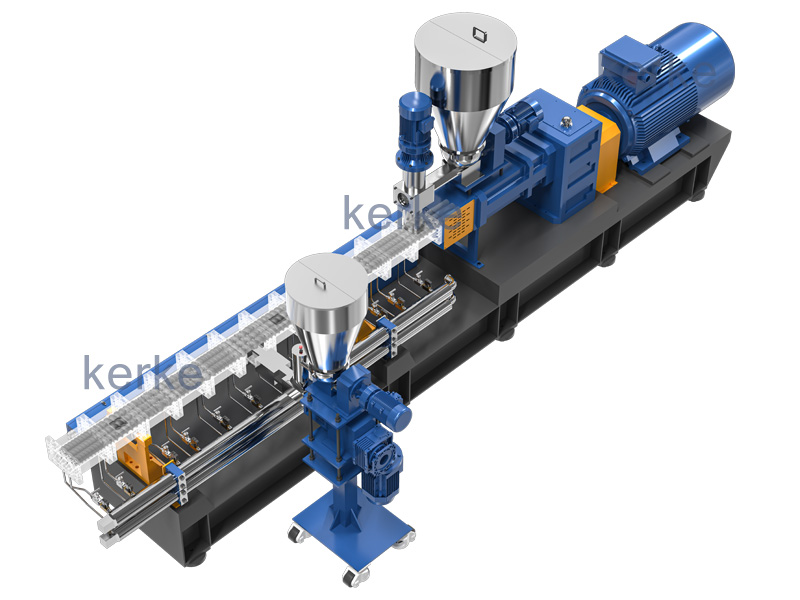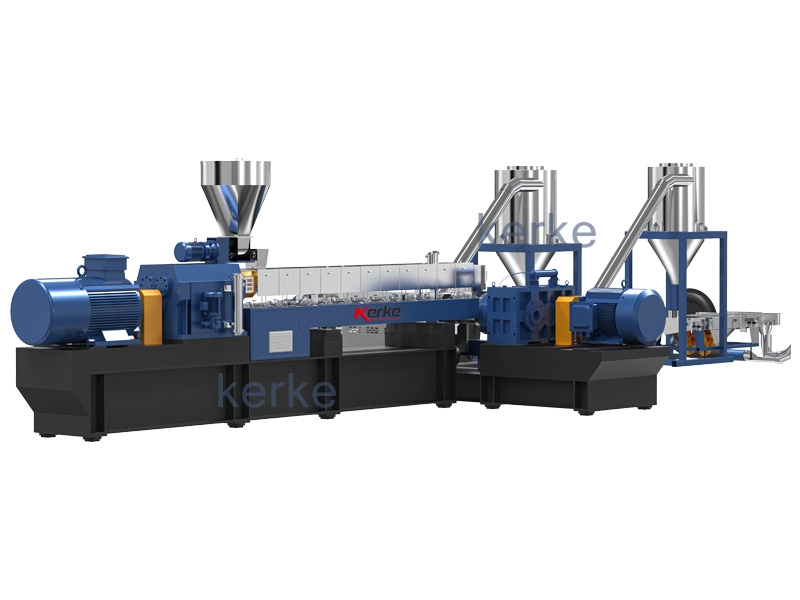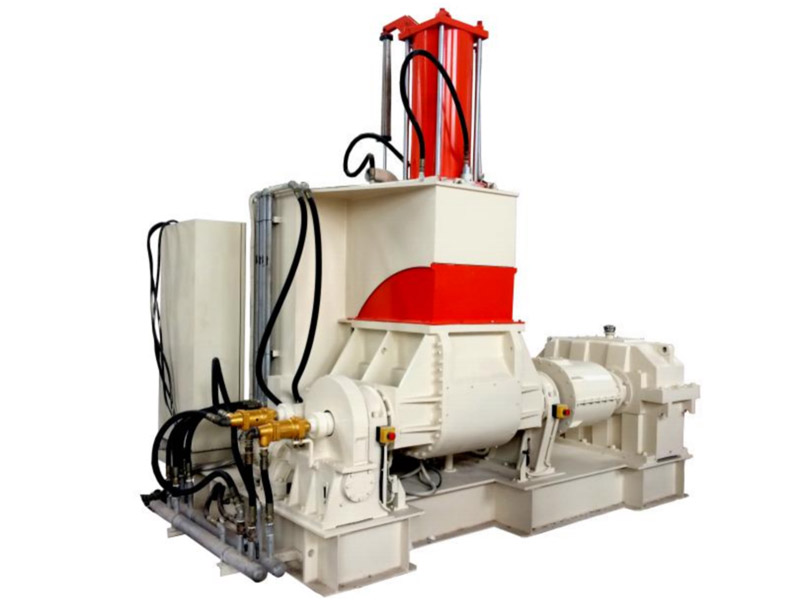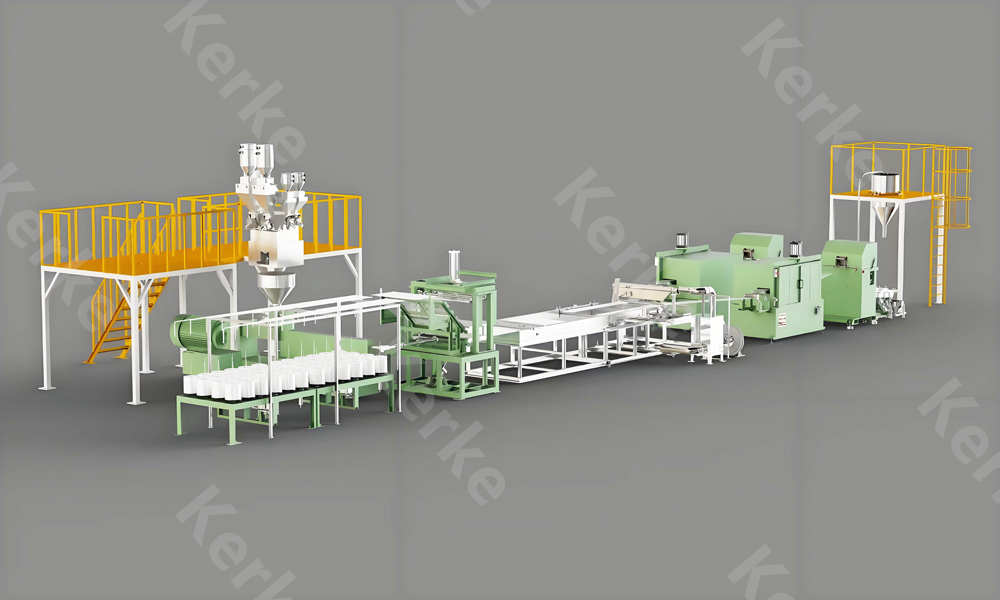
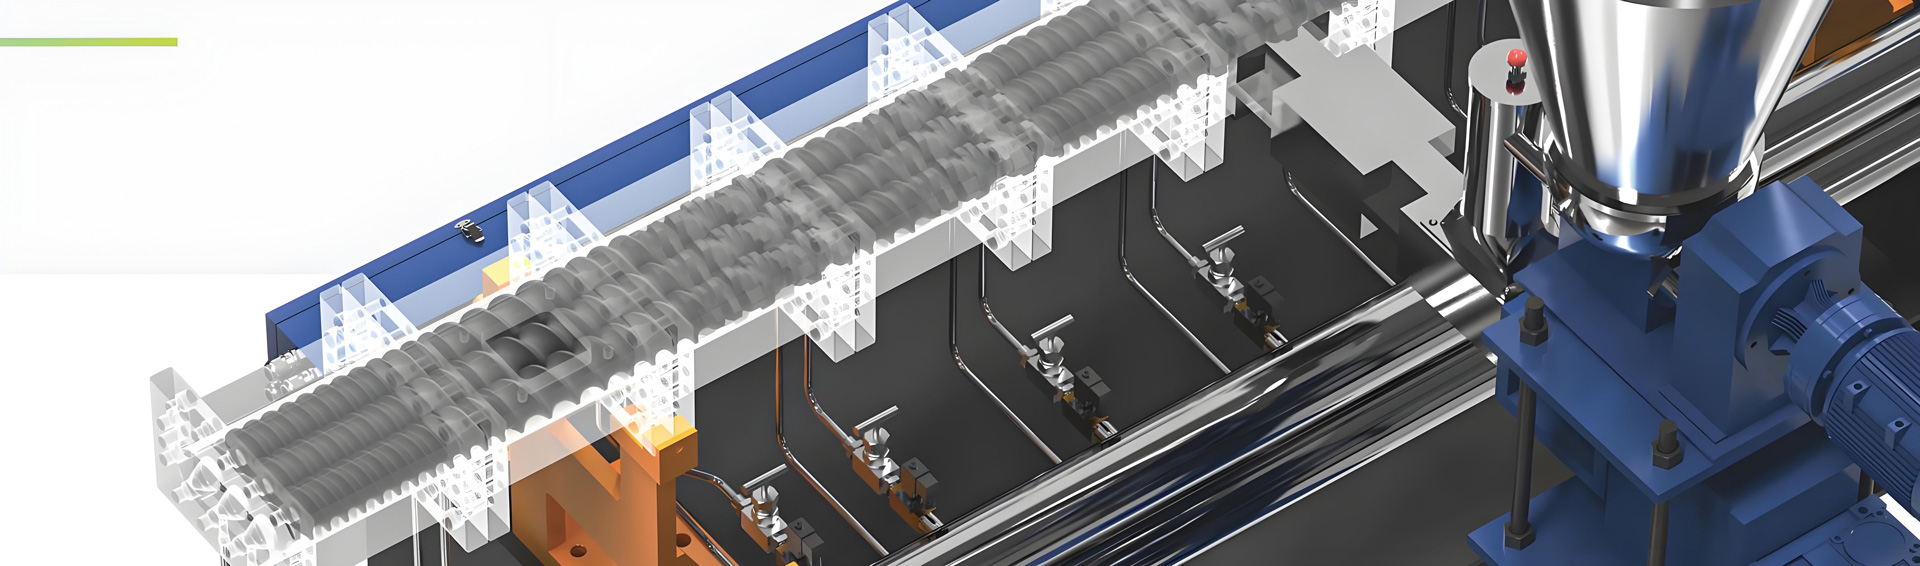
Running a twin-screw modified plastic pellet manufacturing plant is less about the sticker price of a compounding line and far more about the long chain of recurring operating costs that determine whether the business stays profitable. The modified plastic pellet manufacturing cost is dominated not by the machine itself but by the materials that pass through it, the energy it consumes, the wear parts it burns through, and the labor and quality systems that keep the output consistent. This article delivers a detailed full cost breakdown to run twin screw modified plastic pellet manufacturing plant operations, built around a transparent index method so that any plant manager can benchmark their own line regardless of local tariffs or resin pricing.
We express every cost block in index points against a total cash cost baseline set at 100 index points. This removes the need for any currency quotation while preserving the relative weight of each expense, the volatility of each block, and the unit consumption that actually drives the number. A twin-screw extruder based compounding line converts commodity and engineering resins, glass fiber, mineral fillers, compatibilizers, flame retardants, antioxidants, light stabilizers, color and lubricants into uniform modified plastic pellets through compounding and pelletizing. The barrel, screw elements, gravimetric feeder, screen changer and cutting system all contribute to the operating profile, and each carries a distinct cost signature.
Kerke, a Wanplas factory with more than 12 years of specialization in parallel co-rotating twin-screw compounding extruders, supplies the KTE series ranging from the KTE-16B laboratory unit to the high-capacity KTE-135D, plus loss-in-weight and side-feeding systems used across masterbatch, engineering plastic and halogen-free flame-retardant production. The same cost logic applies whether you run a Kerke line, a Coperion ZSK, a Leistritz ZSE, a KraussMaffei Berstorff KMD or a JSW TEX twin-screw extruder, because the expense structure is driven by physics and formulation rather than by brand. By the end of this guide you will be able to allocate your own 100 index points, rank your cost-reduction opportunities, and read the sensitivity of unit cost to capacity utilization and product yield.
Why a structured cost breakdown matters for a twin-screw compounding plant
A compounding plant is a continuous consumer of value. Unlike a discrete machine tool that sits idle between jobs, a twin-screw extruder compounding line is designed to run around the clock, and every running hour converts purchased raw material into saleable modified plastic pellets while quietly consuming energy, wearing metal and occupying labor. The first discipline of profitable modified plastic pellet manufacturing is to know precisely where the money goes, not in absolute currency but in structure.
Most plants overestimate the importance of machine depreciation and underestimate the weight of formulation and scrap. A structured breakdown exposes these blind spots. When raw material carries 60 to 80 index points and energy carries only 8 to 15, the engineering effort should focus on formula optimization and yield before chasing a marginally more efficient drive. Equally, a plant that ignores changeover purge loss will bleed index points every time it switches from natural resin to a dark color masterbatch.
The breakdown also enables comparison across product families. A filled masterbatch, a glass-fiber-reinforced PA6, a halogen-free flame-retardant PP, a white color masterbatch and a dynamic vulcanized TPV each carry a different cost anatomy. The index method lets a plant manager compare them on a like-for-like basis without exposing sensitive pricing. It also creates a common language between the process engineer who tunes the screw configuration and the commercial manager who sets the pellet sales margin.
Finally, a transparent cost breakdown is the foundation for any investment decision on automation, regrind recovery or waste-gas treatment. You cannot justify a gravimetric feeder upgrade, a centralized vacuum conveying system or a regenerative thermal oxidizer on intuition. You justify it by showing which index block it shrinks and by how many index points. Throughout this article we keep the lens firmly on operating cost detail, leaving payback-period modeling to a companion piece on the same site.
The 100 index-point baseline method and how to read it
We define the total cash cost baseline as exactly 100 index points for one unit mass of finished modified plastic pellets at a reference plant condition. The reference condition assumes a mid-size parallel co-rotating twin-screw extruder, a three-shift operation, an average formulation mix and a nominal good-yield ratio. Every cost block is then assigned index points that sum to 100. Because the baseline is relative, it travels across regions and currencies without distortion.
Each block carries two additional attributes. The first is a share range, because the weight of a block moves with the product mix; a plant running mostly filled masterbatch will sit at one end of the raw-material range, while a plant running engineering compounds sits at the other. The second attribute is a volatility level, which tells the operator how much that block swings with market or process conditions. Raw material is High volatility because resin and glass-fiber pricing moves with feedstock cycles. Energy is Medium because it tracks tariff structure and shift pattern. Wear parts are Low to Medium because they depend mainly on throughput and filler content.
The table below is the master map of the detailed full cost breakdown to run twin screw modified plastic pellet manufacturing plant. It is the anchor for everything that follows. Note that fixed amortization is included as a non-cash allocation inside the 100 index points so that the full cost of production, not only the cash cost, is visible to management.
Master cost map: index points, share range and volatility
| Cost block | Index points (reference) | Typical share range | Volatility level |
|---|---|---|---|
| Raw material and formulation | 66 | 60 to 80 | High |
| Energy (extruder plus auxiliaries) | 11 | 8 to 15 | Medium |
| Wear parts and spare parts | 6 | 4 to 8 | Low to Medium |
| Labor (three shifts) | 6 | 4 to 8 | Low |
| Loss and waste (scrap, purge, rework) | 4 | 2 to 6 | Medium |
| Quality control and in-house testing | 2 | 1 to 3 | Low |
| Environmental control and compliance | 2 | 1 to 3 | Low to Medium |
| Fixed amortization (depreciation) | 2 | 1 to 4 | Low |
| Logistics and packaging | 1 | 1 to 3 | Low |
| Total | 100 | 100 | – |
Raw material and formulation cost: the dominant 60 to 80 index block
Raw material and formulation is the heaviest line in any detailed full cost breakdown to run twin screw modified plastic pellet manufacturing plant. In the reference plant it carries 66 index points and can swing between 60 and 80 depending on the product mix. This block is also the most volatile, because resin, glass-fiber and additive pricing tracks petrochemical and mineral feedstock cycles. Understanding its sub-structure is the single highest-leverage activity in compounding cost control.
Base resin selection and its cost weight
The base resin sets the floor of the formulation cost. Polypropylene PP and polyethylene PE are the lowest-cost commodity resins and dominate filled masterbatch and many halogen-free systems. Polyamide PA6 and PA66, acrylonitrile-butadiene-styrene ABS, polycarbonate PC and polybutylene terephthalate PBT are engineering resins that lift the block toward the top of the 60 to 80 range. A PA66-based compound can carry several times the resin index of a PP-based one, before any filler is added. Selecting the lowest resin that meets the mechanical target is the first cost lever.
Glass fiber and the reinforcement premium
Glass-fiber reinforcement is added as long-glass-fiber pellet or as short chopped fiber at GF20, GF30 or GF40 loading. Each ten points of glass-fiber content adds both material index and wear index, because the hard fibers abrade the screw elements and the barrel liner. A GF30 PA6 compound therefore sits higher on the raw-material range than a neat PA6, and simultaneously accelerates the wear-parts block discussed later. The trade-off is mechanical strength, so the formulation engineer must specify the minimum glass-fiber loading that satisfies the tensile and impact requirements verified by ISO 527 and ISO 179.
Mineral fillers, compatibilizers and functional additives
Mineral fillers such as talc, calcium carbonate CaCO3 and mica are the classic cost-down tools. They displace expensive resin with low-cost mineral, improving stiffness and reducing the resin index, but they also raise wear and can hurt impact strength. A compatibilizer such as maleic-anhydride-grafted PP, written PP-g-MAH, is typically added at 2 to 8 percent to bond polyolefin matrix to polar filler or fiber; it is a small but necessary additive index that protects mechanical properties.
Flame retardants split into halogen-free systems using melamine polyphosphate MPP or melamine cyanurate MCA, and brominated systems paired with antimony trioxide Sb2O3. Halogen-free formulations usually carry a higher additive index and a higher specific energy consumption because of processing sensitivity, but they avoid the compliance burden of restricted substances. Antioxidants such as the 1010 and 168 combination are dosed at 0.1 to 0.5 percent to protect melt stability during compounding and subsequent injection molding. Light stabilizers, UV absorbers and hindered-amine stabilizers extend weatherability for outdoor profiles and automotive parts.
Color, masterbatch and process aids
Color is delivered either as dry pigment powder or as a concentrated color masterbatch. Dry color gives the lowest additive index but demands precise gravimetric feeder calibration and creates dust that must be captured. Color masterbatch simplifies handling and improves dispersion at a small premium. Lubricants and mold-release agents such as ethylene bis-stearamide or zinc stearate reduce torque and improve pellet appearance, and they enter the formulation index at low loading. The combination of these additives, summed over a full year of production, is far from negligible even though each individual dose is small.
Formulation cost compared across five product families
The table below compares five representative formulations on a relative unit-cost index and on the drivers behind that index. The relative unit-cost index is normalized so that a filled masterbatch equals 100; all other rows are multiples of that baseline. This keeps the comparison currency-free while showing the true spread between product families.
Comparison of five formulations: consumption and cost structure
| Formulation | Relative unit-cost index | Resin cost weight | Additive intensity | SEC (kWh/kg) | Wear severity |
|---|---|---|---|---|---|
| Filled masterbatch (CaCO3 / talc) | 100 (baseline) | Low | Low | 0.18 to 0.22 | Medium |
| GF30 PA6 engineering compound | 180 to 230 | High | Medium | 0.26 to 0.32 | Very High |
| Halogen-free flame-retardant PP | 140 to 190 | Medium | High | 0.24 to 0.30 | Medium |
| White color masterbatch | 120 to 160 | Low to Medium | High (TiO2) | 0.20 to 0.26 | Medium |
| Dynamic vulcanized TPV | 220 to 300 | High | High | 0.34 to 0.40 | High |
The spread from 100 to roughly 300 in relative unit-cost index shows why a plant cannot quote a single cost number for “modified plastic pellets.” The twin-screw extruder is merely the converter; the formulation is the cost. A compounding line that runs mostly filled masterbatch will report a raw-material block near 60 index points, while a plant built around glass-fiber PA and TPV will sit near 80.
Energy consumption and specific energy consumption SEC
Energy is the second-largest controllable block in the detailed full cost breakdown to run twin screw modified plastic pellet manufacturing plant, carrying 11 index points in the reference plant and ranging from 8 to 15. The cleanest way to benchmark energy without referencing tariffs is the specific energy consumption SEC, measured in kWh per kg of finished pellet. SEC collapses the entire drive, heating and auxiliary load into a single comparable number.
Host extruder SEC by material class
Filled compounds with high mineral content shear easily and run cool, so their SEC sits at the low end near 0.18 kWh/kg. Engineering plastics such as PA6, PA66, PC and PBT require higher melt temperature and more dispersion work, lifting SEC into the mid range around 0.26 to 0.32 kWh/kg. Dynamic vulcanized TPV is the most energy-hungry because of its high viscosity and demanding mixing duty, reaching the top of the range near 0.40 kWh/kg. Because throughput scales with screw diameter and motor power, a KTE-135D at high capacity spreads its fixed drive loss over more kg and can show a slightly lower SEC than a small laboratory twin-screw extruder running the same formula.
Auxiliary energy load
The host extruder is only part of the energy picture. Vacuum pumps for devolatilization run continuously. Cooling towers and chillers remove the heat of mixing; a chiller is far more energy-intensive per unit cooling than a cooling tower, so plants in cool climates gain an index advantage. Pneumatic or vacuum conveying of pellets and regrind adds load. Most energy-sensitive of all is the dehumidifying dryer used for hygroscopic engineering resins such as PA6 and PA66, which must be dried at 80 to 110 degrees Celsius for 3 to 4 hours before feeding. That pre-drying alone can add a measurable fraction to the energy index for nylon compounds.
Shift pattern, peak-valley tariff and load management
Because the energy block is Medium volatility, the plant can shape it through operations rather than through capital alone. Running the most energy-intensive formulations during off-peak valley hours and reserving light filled masterbatch for peak hours reduces the effective energy index even when the kWh/kg stays constant. A three-shift pattern that keeps the barrel and die thermally stable avoids the repeated heat-up and cool-down cycles that waste energy at every start-stop. Variable-frequency drives on conveyors, cooling pumps and vacuum systems trim part-load consumption. Barrel and die insulation reduces standby heat loss during short stops.
Energy cost is best managed as kWh per kg, not as a tariff line. When SEC drops from 0.32 to 0.26 kWh/kg on an engineering compound, the energy index falls by roughly one fifth without changing a single resin price.
Wear parts and spare parts management
Wear parts and spare parts carry 6 index points in the reference plant, ranging from 4 to 8, and the upper end is reached whenever glass-fiber or mineral-filled compounds dominate the mix. A twin-screw extruder is a precision machine whose screw elements and barrel liner are consumed by the very materials it processes. Managing this block is about predicting life, staging inventory and choosing wear-resistant metallurgy.
Screw elements and the wear map
The screw assembly is built from conveying blocks and kneading blocks. Kneading blocks KB45 and KB90, named for their stagger angle, do the dispersive mixing and therefore wear fastest. Wear is not uniform along the barrel; it concentrates in the high-shear kneading and reversing sections where glass fiber and filler are worked. Under glass-fiber load, screw element life drops to 3000 to 6000 hours, whereas unfilled general-purpose compounds permit 12000 to 20000 hours. Rebuilding or replacing a full set of screw elements is a Medium to High cost event, so the scheduling of changeouts against planned maintenance windows protects both the wear index and the loss index.
Barrel liner, screen changer and cutting system
The barrel liner, the inner wear surface of the barrel, follows a wear curve similar to the screw elements and is often re-lined rather than replaced whole. The screen changer filter traps contaminants and gels; filter packs are consumed at a frequency set by the cleanliness of the feed and the use of regrind, and a continuous screen changer reduces the loss associated with each swap. The pelletizing knife and die face wear with throughput and with abrasive fillers; knife replacement is a low-cost but high-frequency event. The load cell of the loss-in-weight gravimetric feeder is a precision item whose calibration drift, not mechanical wear, drives its service cost, and it must be verified on a fixed schedule to protect formulation accuracy.
Wear parts register with cycle, impact and cost level
| Wear part | Replacement cycle (unfilled / glass-fiber) | Process impact if neglected | Cost level |
|---|---|---|---|
| Kneading blocks KB45 / KB90 | 12000 to 20000 h / 3000 to 6000 h | Dispersion loss, property drop | Medium to High |
| Conveying screw blocks | 12000 to 20000 h / 4000 to 7000 h | Throughput loss, surging | Medium |
| Barrel liner | 15000 to 25000 h / 4000 to 8000 h | Clearance rise, melt slip | High |
| Screen changer filter pack | Per 1 to 4 weeks by feed cleanliness | Pressure rise, gel, die drool | Low |
| Pelletizing knife and die face | 200 to 1500 h by abrasiveness | Off-spec pellet, fines | Low |
| Gravimetric feeder load cell | Calibrate every 3 to 6 months | Dosing error, off-spec | Low |
The lesson for the cost engineer is that the wear index is not fixed; it is a function of formulation aggressiveness and of maintenance discipline. Staging screw elements and barrel liners as planned inventory converts an unpredictable High-cost emergency into a scheduled Medium-cost event, and it protects the loss index by avoiding unplanned downtime.
Labor organization across three shifts
Labor carries 6 index points in the reference plant, ranging from 4 to 8, and is the lowest-volatility block because wage structures change slowly. A continuous compounding operation is organized in three shifts to keep the twin-screw extruder running close to 24 hours per day, because stopping and restarting the barrel wastes energy and generates startup scrap.
Roles and headcount per shift
A typical shift team covers the host extruder operation, material feeding and minor blending, pellet packaging, quality sampling and basic housekeeping. Above the shift teams sit a process engineer who owns screw configuration and parameter windows, and a maintenance technician who owns the wear-parts program. The productivity metric that matters is kilograms per person per shift; automating feeding, conveying and bagging raises this ratio and pushes the labor index toward the low end of its range without cutting output.
Automation as a labor-index lever
Centralized vacuum conveying removes manual bag handling at the feed throat. Automatic weighing and bagging lines remove manual packaging. A gravimetric feeder network with recipe management reduces the operator’s dosing burden and improves consistency. Each automation step trades a small capital and depreciation index for a lower labor index and, importantly, for a lower loss index because manual handling introduces contamination and spillage. The right automation level depends on throughput; below a certain volume the labor saving does not justify the added complexity.
Quality control and in-house testing cost
Quality control and in-house testing carry 2 index points in the reference plant, ranging from 1 to 3. This block is small in cash terms but strategic, because weak testing lets off-spec product escape and inflates the far larger loss and raw-material blocks through returns and rework. A compounding plant earns its margin by holding a tight property window, not by testing occasionally.
Test suite and the standards behind it
The melt flow index is measured per ISO 1133 (the Chinese equivalent GB/T 3682) to confirm lot-to-lot viscosity consistency. Tensile and flexural properties are verified per ISO 527, and impact strength per ISO 179, establishing that glass-fiber and toughener levels delivered the target. Ash content per ISO 3451 confirms filler and glass-fiber loading. Moisture is checked for hygroscopic resins. Flammability is rated per UL 94 and, where relevant, per IEC 60695 for glow-wire resistance, which matters for electrical and appliance compounds. Color is judged with a spectrophotometer reporting the color difference value delta E against the master standard.
Batch retention and traceability
Every production lot is retained as a sample and linked to the screw configuration, gravimetric feeder setpoints and raw-material batch numbers. This traceability is the cheapest insurance against a recall-level defect and supports substance compliance documentation such as REACH and RoHS declarations that customers in the electronics and automotive supply chain require. The testing block also covers the cost of external laboratory validation for regulated properties, which rises with the share of halogen-free and low-emission formulations.
Loss and waste cost from startup scrap and changeover
Loss and waste carry 4 index points in the reference plant, ranging from 2 to 6, and this is one of the most under-managed blocks because the loss is visible only in kg of scrap, not in a monthly invoice. The loss index is built from startup waste, changeover purge, dust carry-off, packaging breakage and rework or downgrade.
Startup scrap and steady-state qualification
Every time the twin-screw extruder is started, the barrel and die must reach temperature and the melt must stabilize before product meets specification. The material produced during warm-up is startup scrap. Tight start-up procedures, pre-heated barrel zones and a fast first-sample test shorten this window. Once steady state is reached, the line runs near zero loss until the next event.
Changeover purge and the color sequence rule
The largest controllable loss is changeover between formulations and colors. Switching from a light natural compound to a dark color masterbatch requires purge material measured in kg per changeover and lost capacity measured in hours per changeover. The single most effective scheduling rule is to run colors and formulations in a shallow-to-deep sequence: start with white and light pastels, move through mid tones, and finish with black and deeply pigmented compounds, so that each purge needs less cleaning material than the reverse order. Purge material should be recovered and re-fed where specification allows, converting waste index into recovered raw-material index.
Dust, breakage and downgrade
Fine powder from mineral fillers and pigments can carry off in the ventilation stream; captured dust should be returned to the process where safe. Bag and jumbo-bag breakage during handling creates lost finished pellet. Rework and downgrade occur when a lot misses a property window; downgraded pellet still sells but at a lower index, so the loss is the gap between grade prices rather than a total write-off. Holding the yield ratio high is therefore the master control on this block.
Environmental control and compliance cost
Environmental control and compliance carry 2 index points in the reference plant, ranging from 1 to 3, and the level rises with throughput, with dusty formulations and with halogen-free or low-emission requirements. This block is mandatory rather than optional, and it protects the operating license.
Dust and fume treatment
Mineral filler and pigment handling generates dust at the feed and bagging points. Pulse-jet bag filters or cartridge dust collectors capture it; their running cost is the fan power plus periodic filter replacement. Volatile organic compounds from some additives and from degraded polymer are treated by activated-carbon adsorption or, at higher throughput, by a regenerative thermal oxidizer. Noise from the extruder, pelletizer and air conveyor is controlled by enclosures and silencers to meet plant-boundary limits.
Hazardous waste, permits and substance compliance
Contaminated filter dust, spent activated carbon and off-spec slurry are hazardous or special wastes that carry a per-ton disposal cost and a documentation burden. The plant needs an effluent and emission permit and must keep it current. Substance compliance adds testing and declaration cost: REACH registration and authorization for chemicals placed on the European market, RoHS limits on restricted substances for electronics applications, and UL 94 plus IEC 60695 evidence for flame and glow-wire performance. None of these is large in index terms, but all are non-negotiable, and the cost grows with the complexity of the formulation portfolio.
Fixed amortization and equipment depreciation
Fixed amortization carries 2 index points in the reference plant, ranging from 1 to 4, and unlike the blocks above it is a non-cash allocation. It represents the spreading of capital invested in the compounding line and its infrastructure over its service life. The twin-screw extruder host is typically depreciated over 8 to 10 years, while auxiliary equipment such as chillers, conveyors and screen changers is depreciated over 5 to 8 years because of faster technology turnover.
What sits inside the fixed block
The fixed block includes depreciation of the extruder, the pelletizing system, the gravimetric feeder network, the dehumidifying dryers, the dust and fume treatment, the building and the power-supply upgrade that a high-capacity line requires. Software such as a manufacturing execution system MES and recipe management is amortized here as well. Although non-cash, this block matters for unit-cost sensitivity because it is fixed: it does not fall when output falls, so it dominates the unit cost at low utilization.
Why depreciation is shown inside the 100
Some managers prefer to separate cash and non-cash cost. We keep depreciation inside the 100 index points so that the full cost of production is visible to pricing decisions. A plant that prices only on cash cost will under-recover its capital at the end of the equipment life. The companion article on this site handles the recovery-period model in detail; here we only note that the fixed index converts directly into pressure on unit cost when utilization drops.
Logistics and packaging cost
Logistics and packaging carry 1 index point in the reference plant, ranging from 1 to 3, the smallest block but one that scales with shipment distance and with packaging choice. Modified plastic pellets leave the plant in 25 kg woven bags, in paper-plastic composite bags, in jumbo bags, or in bulk lined containers, then ride on pallets into trucks and containers.
Packaging selection and container loading
A 25 kg woven bag is the lowest-cost option but the most labor-intensive to handle and the most exposed to moisture and breakage. Paper-plastic composite bags improve moisture protection for hygroscopic compounds such as PA6 at a small premium. Jumbo bags reduce per-kg packaging index for bulk customers but require trained handling. Container loading rate, the fraction of trailer or container volume actually filled, decides the effective logistics index; poor palletization wastes volume and raises the per-kg transport index even when the freight rate is unchanged. Pellet bulk density, set partly by filler content, also affects how many kg fit per container.
Unit cost sensitivity to utilization and yield
The power of the index method appears in sensitivity analysis. Because the raw-material block scales with output while the fixed, labor-standby and part of the energy block are semi-fixed, unit cost falls as utilization rises and as yield improves. This section quantifies that behavior for the plant manager.
Capacity utilization sensitivity
Consider the reference plant at three utilization levels: 60 percent, 75 percent and 90 percent of nameplate throughput. The variable blocks (raw material, most energy, most wear) scale with actual kg, so their per-kg index is roughly constant. The fixed and semi-fixed blocks (depreciation, standby labor, idle utility) are spread over more kg at higher utilization, so their per-kg index shrinks. The table expresses the fixed-and-semi-fixed portion of unit index at each level, normalized to 100 at the 60 percent reference.
Capacity utilization sensitivity table
| Utilization level | Fixed-and-semi-fixed index (relative) | Variable index (relative) | Total unit index (relative) | Versus 60 percent |
|---|---|---|---|---|
| 60 percent | 100 | 100 | 100 | baseline |
| 75 percent | 80 | 100 | 92 | minus 8 percent |
| 90 percent | 67 | 100 | 86 | minus 14 percent |
The table shows that lifting utilization from 60 to 90 percent lowers total unit index by roughly 14 percent, almost entirely by diluting the fixed block. This is why a plant should prefer one line running at 90 percent over two lines each running at 55 percent, all else equal.
Yield sensitivity
Product yield is the ratio of saleable pellets to total material introduced. Every one percentage point drop in yield forces the raw-material and energy embedded in the lost mass to be re-supplied, and it adds scrap-handling cost. Because raw material is 60 to 80 index points, a one-point yield loss raises the effective total index by a small but compounding fraction. A plant that improves yield from 96 to 98 percent can recover more index than a plant that shaves a fraction off energy SEC, underscoring that quality and loss control beat efficiency tweaks for cost leadership.
Cost reduction checklist with payback ranking
The final job of a detailed full cost breakdown to run twin screw modified plastic pellet manufacturing plant is to turn the map into action. The measures below are ranked by typical magnitude of index recovered, by implementation difficulty and by payback period expressed in months. Magnitude is shown as the share of total index typically recoverable; difficulty as Low, Medium or High; payback as a range of months.
Cost reduction measure ranking table
| Measure | Index recovered (typical) | Implementation difficulty | Payback (months) |
|---|---|---|---|
| Shallow-to-deep color and formulation sequencing | 1 to 3 index points | Low | 1 to 3 |
| Purge recovery and regrind re-feed | 1 to 2 index points | Low to Medium | 2 to 5 |
| Filler substitution for part of resin | 3 to 8 index points | Medium | 3 to 8 |
| SEC reduction: VFD, insulation, off-peak shift | 1 to 3 index points | Medium | 4 to 10 |
| Wear-part life management and staging | 1 to 2 index points | Medium | 6 to 12 |
| Feeding and bagging automation | 1 to 3 index points | High | 12 to 24 |
| Yield improvement via tighter QC window | 2 to 5 index points | Medium | 3 to 9 |
The ranking tells a clear story. The cheapest, fastest wins are operational: changeover sequencing and purge recovery need almost no capital and pay back in months. The largest index recoveries come from formulation, specifically filler substitution and yield improvement, which is why the raw-material block deserves the most engineering attention. Capital-heavy automation helps the labor and loss indices but carries the longest payback, so it should be justified by throughput volume rather than by cost panic.
For a plant running a Kerke KTE-series twin-screw extruder or any comparable co-rotating line from Coperion, Leistritz, KraussMaffei Berstorff or JSW, the same index logic applies. The Wanplas brand, through its Kerke factory, supports compounding lines with screw configuration advice, wear-part programs and recipe management that target exactly these index blocks. The shared after-sales commitments of the Wanplas network help keep the wear and loss indices predictable across the equipment life.
Frequently Asked Questions
What is the single largest cost block in a twin-screw modified plastic pelletizing plant?
Raw material and formulation dominate the cost structure, typically absorbing 60 to 80 index points out of a 100 index-point total cash cost baseline, while machine energy, wear parts and labor together account for a much smaller share. The formulation, not the twin-screw extruder, is where the money sits.
How should energy consumption be benchmarked without quoting tariffs?
Use the specific energy consumption SEC in kWh per kg of output. Filled compounds sit at the low end near 0.18 kWh/kg, engineering plastics in the mid range, and dynamic vulcanized TPV at the high end near 0.40 kWh/kg, which maps directly to the energy index points and removes any need for a tariff figure.
Which wear parts drive the highest maintenance index in glass-fiber compounding?
Screw elements, especially kneading blocks KB45 and KB90 and the barrel liner, wear fastest under glass-fiber load, with service life dropping to 3000 to 6000 hours versus 12000 to 20000 hours for unfilled general-purpose compounds. Planned staging of these parts converts an emergency High-cost event into a scheduled Medium-cost one.
Why does capacity utilization change unit cost so strongly?
Fixed and semi-fixed cost blocks such as depreciation, labor and standby utilities are spread over total output, so moving from 60 percent to 90 percent utilization can dilute the fixed portion of unit cost by roughly one third and lower total unit index by about 14 percent.
How does product yield affect the total index points?
Every one percentage point drop in good-yield ratio forces re-processing of the lost mass and raises the effective index by a small but compounding amount, because the raw material and energy embedded in scrap must be re-supplied. A yield move from 96 to 98 percent can recover more index than a modest SEC cut.
What is the fastest payback cost-reduction measure for a compounding line?
A shallow-to-deep color and formulation changeover sequence plus purge-material recovery usually shows the shortest payback, because it directly cuts the changeover loss measured in kg of purge and hours of lost capacity per changeover, with payback often inside three months and Low implementation difficulty.
How are environmental and compliance costs reflected in the index?
Dust collection, VOC treatment, noise control, hazardous-waste disposal and substance compliance such as REACH and RoHS add a low but mandatory index block that grows with throughput and with halogen-free or low-emission formulation requirements. It is small in points but non-negotiable for the operating license.
Which testing standards should a modified plastic pellet plant maintain in-house?
A capable plant runs melt flow per ISO 1133 and GB/T 3682, tensile and flexural per ISO 527, impact per ISO 179, ash per ISO 3451, flammability per UL 94 and glow-wire per IEC 60695, plus color difference delta E checks, and keeps batch retention for REACH and RoHS traceability across the injection molding supply chain.
Conclusion
The detailed full cost breakdown to run twin screw modified plastic pellet manufacturing plant shows that success is won in the formulation and the yield, not in the machine price. With raw material and formulation carrying 60 to 80 index points, energy 8 to 15, and wear, labor, loss, quality, environment, depreciation and logistics filling the remainder to a 100 index-point baseline, the plant manager has a complete map of where value flows and where it leaks.
The index method keeps the analysis honest across regions and currencies: SEC in kWh/kg, wear life in hours, purge in kg per changeover, and utilization in percent all speak the same language whether the line is a Kerke KTE-135D, a Coperion ZSK, a Leistritz ZSE, a KraussMaffei Berstorff KMD or a JSW TEX. The fastest wins are operational, the largest wins are formulation and yield, and the capital-heavy automation wins are justified only by volume. Apply the five tables in this article to your own line, rank your cost-reduction measures by payback, and you turn a vague sense of “expensive to run” into a controlled, index-driven operating model built on a twin-screw extruder, a well-managed barrel and screw program, precise gravimetric feeder dosing, disciplined pelletizing and a clear eye on color, molding-grade quality and total cost of production.