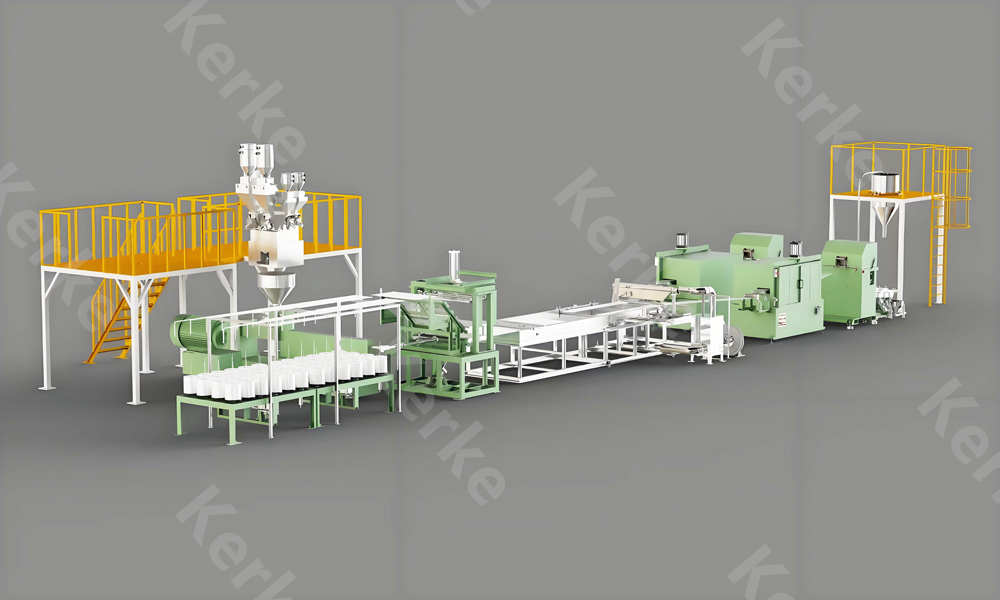
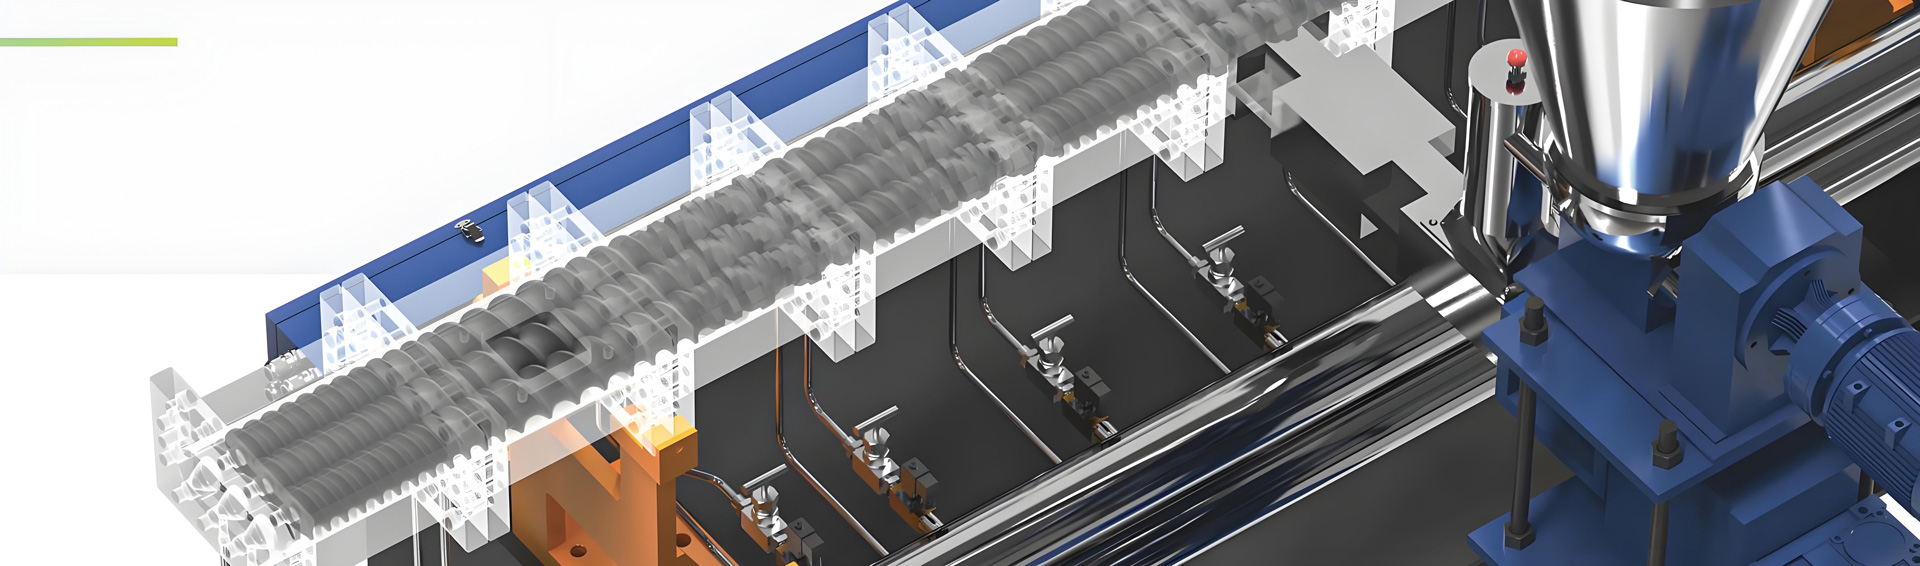
The calculated payback period of a full automatic twin screw masterbatch manufacturing workshop is not a fixed number that can be read off a quotation. It is the outcome of three interacting curves: effective running hours, output per running hour, and first-pass yield rate. Change any one of them by ten percent and the payback window moves in a way that no static spreadsheet cell can capture. This guide sets out a structured, physically grounded model for calculating that payback period, expressed entirely in indexed and relative terms so that the logic remains valid regardless of local conditions, product grade, or the year in which the project is built. Throughout 2026, buyers evaluating masterbatch capacity investments continue to ask the same question in the same wrong form: how many months until the line pays for itself. The better question is which operating curve the workshop will actually live on.
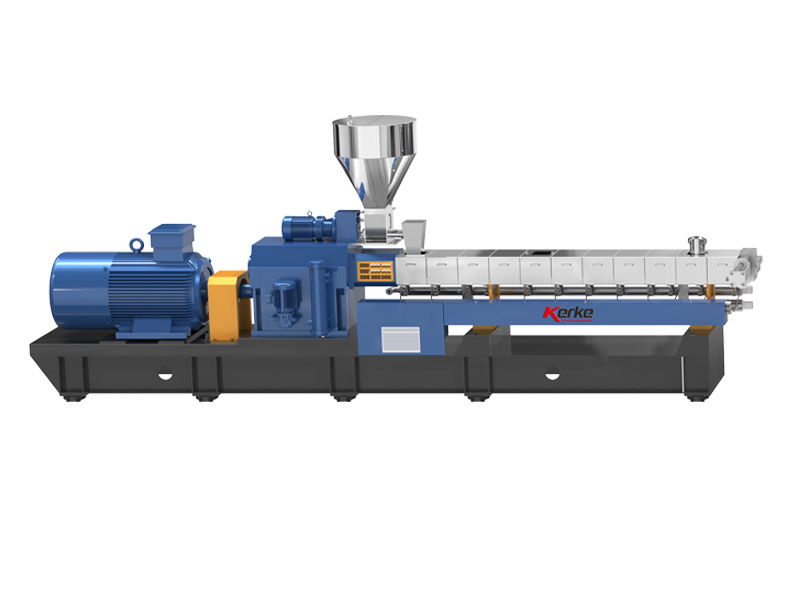
Kerke, a Wanplas factory, is Nanjing Kerke Extrusion Equipment Co., Ltd, a high-tech manufacturer focused exclusively on parallel co-rotating twin screw compounding extruders. With more than 12 years of experience in research, design, manufacturing technique and sales service, a 19,997 square meter production base, over 2,000 machines running in more than 70 countries, and a team of over 100 people, Kerke is recognized as a top five domestic supplier of twin screw extruders in China. The factory slogan, “We Know Compounding Extruder,” reflects a narrow and deliberate specialization: everything from screw element geometry to feeding architecture to pelletizing selection is engineered around compounding throughput and stability. That specialization matters directly to payback, because the payback period of a masterbatch workshop is determined far more by how consistently a line runs than by any single line item on the purchase order.
Core principle: Payback months for a masterbatch workshop are inversely proportional to the product of three fractions — effective running hours ratio, capacity utilization, and first-pass yield rate — multiplied by the conversion margin index of the actual product mix. A line rated at high nameplate throughput that runs at Low utilization with Medium yield will pay back more slowly than a smaller line running at High utilization with Very High yield.
Why Payback Is a Curve, Not a Number
A payback estimate built on nameplate throughput is almost always wrong by a wide margin, because nameplate throughput describes what the extruder can do at the moment of peak stability with an ideal formulation, not what the workshop will do across a full operating year. The gap between the two is where the entire economics of a masterbatch plant lives.
Consider what actually happens on the floor of a color masterbatch workshop. The line starts a shift with a white carrier formulation, runs for four hours, then changes over to a medium-tone formulation, then to a dark formulation, then back to a light shade the next morning after an extended cleaning sequence. Each transition consumes running hours. Each transition creates a quantity of transition material that is either downgraded, reworked, or scrapped. Each new shade demands a color match verification step before the operator releases full-rate production. None of this appears in the nameplate figure, yet collectively these factors can determine whether annual saleable output lands at 55 percent or 85 percent of theoretical capacity.
The correct mental model is a chain of multiplicative fractions. Theoretical annual output equals nameplate kilograms per hour multiplied by 8,760 hours. Every real-world factor removes a slice:
- Calendar availability — the shift pattern chosen, statutory holidays, and planned shutdowns for maintenance define the maximum window in which the barrel can be hot at all.
- Scheduled process losses — formulation changeovers, screw and barrel cleaning, screen changes, and startup or shutdown sequences consume hours inside that window.
- Unplanned downtime — feeder faults, pelletizer strand breaks, vacuum system blockage, motor protection trips, and utility interruptions remove further hours in an unpredictable pattern.
- Rate derating — many formulations cannot be run at the machine’s maximum rate because of torque limits, feed limits, degassing limits, or downstream cooling limits.
- Yield loss — off-color pellets, moisture-induced voids, irregular pellet geometry, and screening rejects reduce the saleable fraction of what was extruded.
Multiply these fractions and a nameplate figure of, for example, 600 kilograms per hour can translate into an annual saleable tonnage equivalent to something between 3,000 and 4,600 operating hours at full rate. That is a spread of more than 50 percent in output between a poorly managed and a well managed workshop using identical equipment, and it is the single largest source of payback dispersion in this industry.
The Three Curves That Define the Payback Surface
Rather than a single number, treat the payback of a full automatic twin screw masterbatch manufacturing workshop as a surface defined by three curves that move independently and interact multiplicatively.
The first curve is effective running hours. This is a function of shift pattern, maintenance discipline, changeover frequency, and the reliability of the weakest subsystem in the line. It has a hard ceiling set by the calendar and a soft floor set by management quality. A two-shift operation cannot reach the running hours of a three-shift operation no matter how good its maintenance is, but a badly run three-shift operation can easily fall below a well run two-shift operation in effective hours.
The second curve is output per running hour. This is set by machine size, torque grade, screw configuration, feeding architecture, and the physical characteristics of the formulation. A high-filler calcium carbonate masterbatch on a high-torque machine with a well-positioned side feeder will run at a multiple of the rate achievable for a high-concentration organic pigment masterbatch on the same machine, because the limiting mechanism is different in each case. In the filler case the limit is torque and feed volume; in the pigment case the limit is dispersion residence time and shear history.
The third curve is first-pass yield rate. This is the fraction of extruded material that leaves the workshop as saleable first-grade product without rework. It is driven by color consistency, moisture control, pellet geometry uniformity, and contamination control. Yield rate is deceptively powerful because it acts twice: it reduces saleable output directly, and it consumes running hours a second time when rejected material is reprocessed.
The payback period is inversely proportional to the product of these three curves, scaled by the conversion margin index of the product mix. Understanding this structure is what separates a defensible investment model from an optimistic guess.
What Counts as a Full Automatic Masterbatch Workshop
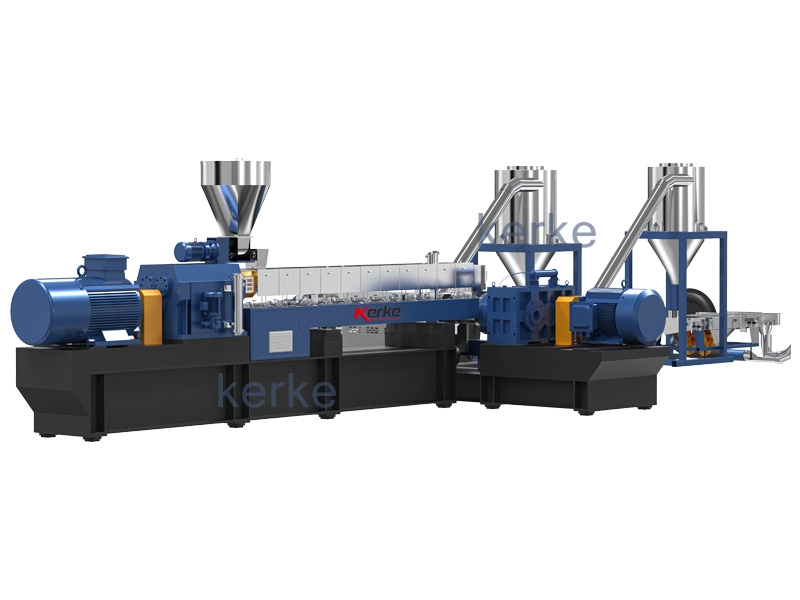
A full automatic twin screw masterbatch workshop is defined not by the presence of a computer screen but by the absence of manual intervention in the material path from raw material intake to packaged finished pellets. Every point at which a human hand touches the material is a point of variability, a point of labor consumption, and a point of potential contamination. Automation removes those points, and each removal has a measurable effect on shift headcount, changeover time, and batch-to-batch consistency.
The following subsystems constitute the practical definition of full automation in a masterbatch compounding workshop.
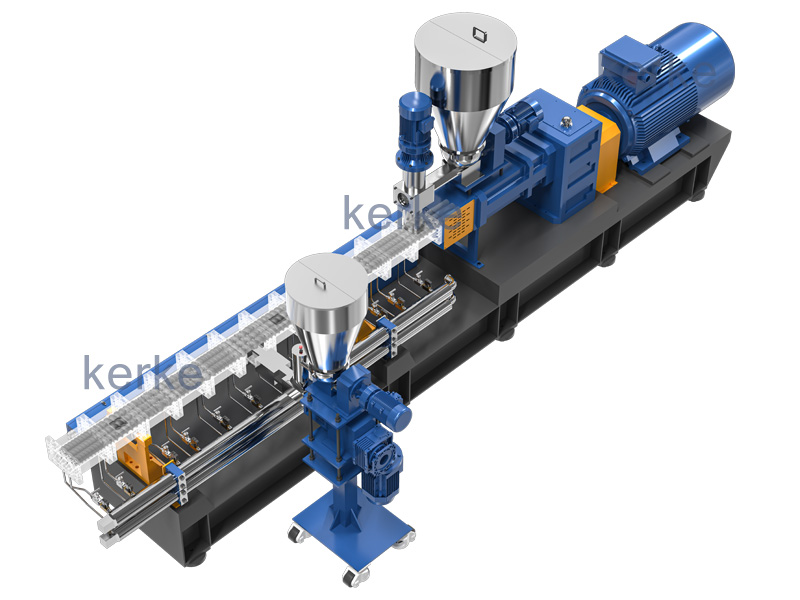
Loss-In-Weight Multi-Component Gravimetric Feeding
Loss-in-weight feeding is the foundation of automated masterbatch production. Each component — carrier resin, pigment or filler, dispersant, stabilizer, lubricant — is metered by continuous weight loss rather than by volume, which eliminates the error introduced by variations in bulk density, particle size, and flow behavior. A typical color masterbatch line uses three to six loss-in-weight feeders; a high-filler line may use two main feeders plus a side feeder assembly. Volumetric metering is acceptable for single-component, stable-density feeds, but it cannot deliver the batch consistency that a masterbatch buyer expects when the pigment loading tolerance is measured in tenths of a percent.
The payback relevance is direct. Gravimetric control reduces the frequency of off-specification batches, which lifts the first-pass yield curve. It also removes the manual pre-blending step, which reduces headcount and eliminates a source of cross-contamination between shades.
Automatic Central Feeding and Vacuum Conveying
Central feeding with vacuum conveying moves raw material from silos, bulk bags, or drying hoppers directly to the feeder hoppers without manual charging. In a workshop producing multiple formulations, a well-designed conveying network with dedicated lines for high-contamination-risk materials such as carbon black prevents the shade contamination that forces downgrading. Automatic conveying also allows a line to run continuously through a shift change without the interruption caused by manual hopper filling.
On-Line Moisture and Melt Pressure Monitoring
Moisture entering the barrel with hygroscopic carriers or with wet fillers produces voids in the strand, surface defects, and in extreme cases strand breakage that halts pelletizing. On-line moisture monitoring at the dryer outlet and melt pressure monitoring at the die allow the control system to detect a developing problem before it becomes a batch of rejected pellets. Melt pressure trend data is also the most reliable early warning of screen pack blinding and of screw element wear.
Automatic Screen Changer
A manual screen change on a compounding line means stopping the extruder, purging, replacing the screen pack, and restarting — a sequence that can consume 20 to 45 minutes and produce a quantity of transition material. A continuous or hydraulic automatic screen changer performs the exchange without stopping production, converting a hard downtime event into a brief pressure transient. On a line running highly filled or contaminated formulations where screen changes may be required several times per shift, this single component can shift the effective running hours curve by several percentage points.
Water Ring or Underwater Pelletizing With Automatic Drying and Vibratory Screening
Die-face pelletizing systems — water ring hot cutting and underwater granulation — remove the strand-handling step entirely. There is no strand to break, no operator to re-thread the strands into the pelletizer, and no strand bath to monitor. The pellets travel through a centrifugal dryer and then across a vibratory screen that removes fines, oversize agglomerates, and dimples. Automatic screening is what makes pellet geometry consistency an engineering property rather than an operator skill.
Automatic Packing and Palletizing
Automatic weighing, bagging, sealing and palletizing closes the loop at the end of the line. In a manual packing arrangement, packing frequently becomes the constraint that forces the extruder to slow down or stop during peak output periods. Automatic packing removes that constraint and simultaneously removes two to three positions per shift from the headcount.
Centralized Control and Recipe Management
A centralized control architecture with stored recipes allows an operator to select a formulation and have every setpoint — barrel zone temperatures, screw speed, feeder rates, vacuum level, water temperature, pelletizer speed — loaded in a single action. The effect on changeover time is substantial, because the largest component of a formulation change is often not the physical cleaning but the parameter re-establishment and the trial-and-adjust cycle that follows it. Recipe recall converts that cycle into a repeatable sequence.
Automation Level Comparison Table
| Attribute | Manual / Basic Line | Semi-Automatic Line | Full Automatic Workshop |
|---|---|---|---|
| Metering method | Manual pre-blend in high-speed mixer | Volumetric main feeder plus manual additives | Multi-component loss-in-weight, 3 to 6 feeders |
| Material conveying | Manual charging by bag | Single vacuum loader per hopper | Central feeding network with dedicated lines |
| Screen change | Manual, full stop, 20 to 45 min | Plate-type changer, short stop, 5 to 12 min | Continuous changer, no production stop |
| Pelletizing | Water-cooled strand, manual threading | Strand with automatic feed roller | Water ring or underwater die-face hot cutting |
| Drying and screening | Ambient air, manual sieve | Centrifugal dryer only | Centrifugal dryer plus vibratory classifying screen |
| Packing | Manual scale and hand sewing | Semi-auto weigher, manual palletizing | Automatic weigh-bag-seal plus robot palletizer |
| Typical headcount per shift | 6 to 9 persons | 4 to 6 persons | 2 to 3 persons |
| Typical shade changeover time | 120 to 240 min | 70 to 140 min | 35 to 80 min |
| Batch-to-batch consistency | Low | Medium | High to Very High |
| Typical first-pass yield band | 88 to 93 percent | 92 to 96 percent | 96 to 99 percent |
| Relative investment level | Low | Medium | High to Premium |
The pattern in this table is the reason full automation frequently pays back faster despite a higher investment index. Headcount per shift falls by roughly 60 percent, changeover time falls by roughly 65 percent, and the yield band shifts upward by four to six percentage points. Two of those three effects act directly on the effective output curves, not merely on the operating expense side.
The Three-Layer Payback Calculation Framework
A defensible payback model for a full automatic twin screw masterbatch manufacturing workshop has exactly three input layers: the investment layer, the output layer, and the conversion margin layer. Keeping these separate prevents the most common analytical error, which is mixing capacity assumptions into margin assumptions and losing the ability to test either independently.
Layer One: The Investment Side, Expressed in Index Points
Set the total installed investment of the reference workshop equal to 100 index points. This baseline reference is a single full automatic compounding line built around a mid-size high-torque co-rotating twin screw extruder, complete with multi-component gravimetric feeding, water ring die-face pelletizing, automatic drying and screening, automatic packing, and centralized control, installed in a prepared building. Distributing the 100 index points across subsystems gives the following typical structure.
| Investment Block | Typical Share (index points of 100) | Variability | Main Driver of Variation |
|---|---|---|---|
| Main twin screw extruder (barrel, screws, gearbox, motor) | 40 to 50 | Medium | Screw diameter, torque grade, L/D, barrel and screw metallurgy |
| Feeding system (loss-in-weight, side feeder, crammer, liquid) | 10 to 16 | High | Number of components, accuracy class, explosion-proof needs |
| Pelletizing and downstream (cutter, dryer, screen, conveying) | 12 to 20 | High | Strand vs die-face vs underwater configuration |
| Auxiliary equipment (mixer, dryer, chiller, pulverizer, crusher) | 8 to 14 | Medium | Material preparation depth, cooling load |
| Electrical control, recipe management, data acquisition | 6 to 10 | Medium | Automation depth, remote monitoring, component grade |
| Plant utilities and installation (power, water, air, ventilation, foundations) | 8 to 16 | Very High | Existing building condition, transformer capacity, local codes |
| Initial spares, tooling and screw element sets | 3 to 6 | Low | Number of formulations, wear severity of fillers |
Two observations follow immediately from this distribution. First, the main extruder is a minority of total investment even though it receives the majority of buyer attention. Second, the plant utilities block has Very High variability, which means a project evaluated on equipment quotations alone can be materially wrong on the investment denominator. A workshop retrofitted into a building with insufficient transformer capacity or inadequate ventilation will carry an investment index well above 100 for the same nominal equipment set.
Layer Two: The Output Side
Annual saleable output is the product of four terms:
- Rated hourly capacity for the specific formulation, in kilograms per hour. Note that this must be formulation-specific, not a single machine number.
- Effective annual running hours, derived from shift pattern minus planned and unplanned losses.
- Capacity utilization, the fraction of available running hours in which the line actually has orders to fill at the planned rate.
- First-pass yield rate, the fraction of extruded output that is saleable as first-grade product.
Expressed as an equation in words: annual saleable tonnage equals rated hourly capacity times effective running hours times capacity utilization times yield rate, divided by one thousand. Each of these four terms is independently measurable, independently improvable, and independently testable in a sensitivity analysis.
Layer Three: The Conversion Margin Index
The third layer converts physical output into return without referencing any monetary amount. Define a conversion margin index as the value added per unit mass of material processed, relative to a baseline. Set standard calcium carbonate filler masterbatch at 100 index points per ton of conversion margin. Every other product category is then expressed as a multiple or fraction of that baseline.
| Product Category | Conversion Margin Index (baseline = 100) | Relative Throughput | Margin per Running Hour (relative) |
|---|---|---|---|
| Calcium carbonate filler masterbatch (70 to 80 percent loading) | 100 | Very High | 1.00x (reference) |
| Black masterbatch (25 to 45 percent carbon black) | 180 to 260 | High | 1.3x to 1.9x |
| General color masterbatch (10 to 30 percent pigment) | 280 to 420 | Medium | 1.4x to 2.2x |
| Textile and fiber-grade color masterbatch | 420 to 650 | Low to Medium | 1.6x to 2.6x |
| Functional and additives masterbatch (antistatic, UV, flame retardant, anti-blocking) | 400 to 700 | Low to Medium | 1.5x to 2.8x |
| Engineering plastic compound (glass-fiber reinforced) | 320 to 520 | Medium | 1.5x to 2.4x |
| Biodegradable compound (PLA, PBAT based) | 350 to 600 | Low to Medium | 1.4x to 2.5x |
The fourth column is the number that actually matters. A category with a Very High conversion margin index but Low throughput may generate less return per running hour than a category with a modest index and Very High throughput. This is why the product mix decision cannot be made on margin index alone, and why a workshop that chases only high-value functional masterbatch can end up with a longer payback than one that runs a balanced mix. The correct optimization target is margin index per running hour, weighted by the share of hours each category occupies.
Deriving Effective Annual Running Hours
Effective annual running hours is the most under-modeled term in masterbatch workshop payback calculations, and it is also the easiest to derive rigorously. Start from the calendar, subtract in a defined order, and never subtract the same loss twice.
The derivation proceeds as follows. Begin with 8,760 calendar hours. Apply the shift pattern to obtain scheduled hours. Subtract statutory holidays and planned annual maintenance shutdown. Subtract scheduled process losses: formulation changeovers, deep cleaning between incompatible shades, screen pack changes where not continuous, and startup and shutdown sequences. Finally apply an unplanned downtime rate. What remains is effective running hours.
| Derivation Step | Two-Shift Pattern | Three-Shift, 6-Day Week | Three-Shift, Continuous |
|---|---|---|---|
| Calendar hours | 8,760 | 8,760 | 8,760 |
| Scheduled hours after shift pattern | approx. 4,180 | approx. 7,150 | approx. 8,300 |
| Less statutory holidays and annual shutdown | -260 to -340 | -420 to -560 | -460 to -620 |
| Less changeover and cleaning (full automatic, mixed shades) | -320 to -520 | -540 to -880 | -620 to -1,020 |
| Less startup, shutdown and purge sequences | -180 to -260 | -140 to -220 | -90 to -160 |
| Unplanned downtime rate applied | 4 to 8 percent | 4 to 8 percent | 5 to 9 percent |
| Effective running hours band | 2,900 to 3,300 | 5,000 to 5,700 | 5,900 to 6,800 |
| Effective hours as share of calendar | 33 to 38 percent | 57 to 65 percent | 67 to 78 percent |
| Relative payback speed (two-shift = 1.00x) | 1.00x | 1.65x to 1.85x faster | 1.95x to 2.20x faster |
The final row is the practical conclusion. Moving from two shifts to continuous three-shift operation nearly doubles the speed of payback, because the investment denominator is unchanged while the output numerator roughly doubles. Very few equipment specification decisions can deliver that magnitude of effect. This is the first and most important reason to design the workshop around continuous operation from the outset: adequate barrel and screw wear allowance, redundant cooling, spare screw element sets on the shelf, and a maintenance calendar that fits into planned windows rather than forcing unplanned stops.
Note also the behavior of the startup and shutdown line. A two-shift operation stops and restarts the line roughly 250 times per year; a continuous three-shift operation may stop it 40 to 60 times. Each cold start consumes barrel heating time, produces transition material, and applies a thermal cycle to the barrel liners and screw elements. Fewer thermal cycles means longer wear part life, which feeds back into both the running hours curve and the maintenance requirement.
Changeover Time: The Quiet Consumer of Running Hours
For a color masterbatch workshop, changeover is usually the largest single controllable loss. A workshop running 4 to 6 shade changes per day at 60 minutes each loses 4 to 6 hours per day, which over a continuous year is 1,400 to 2,100 hours — a figure comparable to an entire shift pattern. Three levers reduce this loss:
- Production sequencing — running from light shades to dark shades within a campaign, and grouping compatible carrier resins, can cut average changeover time by 25 to 40 percent without any capital spending.
- Quick-change barrel and screw hardware — clamshell or split barrel designs and quick-release screw shafts reduce the physical portion of a deep clean substantially.
- Recipe recall and closed-loop feeder control — removing the trial-and-adjust cycle after each change is often worth 15 to 25 minutes per changeover on its own.
A workshop that reduces average changeover time from 90 minutes to 55 minutes at five changes per day recovers roughly 1,060 running hours per year in a continuous operation. Against a baseline of 6,000 effective hours that is an 18 percent increase in output capability at zero increase in the investment index.
Capacity Utilization Scenarios and Payback Leverage
Capacity utilization is the single most powerful lever in the entire payback model, more powerful than machine size, torque grade, or automation level. It answers a different question from the others: not how fast can the line run, but how much of the time does it have orders to run at the planned rate.
A workshop equipped with a Very High-capacity line but serving a market that only fills 60 percent of its running hours will have a longer payback than a smaller line running at 90 percent utilization in the same market, because the investment denominator is larger and the output numerator is smaller at the same time. Utilization is therefore the first number a serious buyer should forecast, before finalizing machine size.
The following scenario table holds all other variables constant at a reference point — effective running hours at the continuous three-shift band, first-pass yield at 96 percent, and a balanced product mix with a conversion margin index of 200 — and varies only utilization.
| Scenario | Capacity Utilization | Relative Annual Return | Payback Months (relative, baseline 90% = 1.00x) | Versus 60% Case |
|---|---|---|---|---|
| Low demand / start-up market | 60 percent | 0.67x | 1.50x (longest) | reference |
| Developing account base | 70 percent | 0.78x | 1.29x | 14 percent shorter |
| Established regional supplier | 80 percent | 0.89x | 1.13x | 25 percent shorter |
| Strong order book, balanced mix | 90 percent | 1.00x (baseline) | 1.00x (shortest) | 33 percent shorter |
The headline result: moving from 60 percent to 90 percent utilization raises annual return by roughly 50 percent and therefore compresses the payback window by roughly one third. This is not a marginal effect. It is the difference between a project that an investment committee accepts and one it rejects. Because utilization depends on commercial factors — order book, sales reach, product range breadth — it is the variable most within the control of the business rather than the equipment supplier.
Why Utilization Differs From Running Hours
It is important to keep utilization distinct from effective running hours. Effective running hours describes the time the line is physically capable of producing. Capacity utilization describes the portion of that capable time for which there is paid demand at planned rate. A line can have very High effective running hours achieved through three-shift operation yet still sit idle during many of those hours because orders have not arrived. Both terms multiply, so a workshop weak on either axis sees its return fall on two fronts at once.
Two planning rules follow. First, do not oversize the machine beyond the realistic utilization forecast; the unused capacity is non-recoverable investment. Second, invest the commercial effort to lift utilization before investing capital to lift throughput, because the return per effort is usually higher on the demand side for a new entrant.
Yield Rate, Rework and the Output Multiplier
First-pass yield rate is the fraction of material extruded and pelletized that leaves the workshop as saleable first-grade product without being reprocessed. It is the most deceptive term in the payback model because its true cost is double-counted by most spreadsheets: they subtract the lost material once as reduced output, but forget to add back the running hours consumed by rework.
In masterbatch, the typical loss mechanisms are specific and addressable:
- Color deviation and off-shade batch — caused by feeder drift, pigment lot variation, or insufficient dispersion. Requires rework or downgrade.
- Moisture-induced voids and surface defects — caused by inadequate drying of hygroscopic carriers or wet fillers, or by insufficient vacuum degassing.
- Pellet geometry irregularity — fines, agglomerates, and dumbbells from unstable cutting, which are removed by screening and either discarded or reworked.
- Contamination and cross-shade carry-over — especially in carbon black and high-chroma pigment production, which forces downgrading of an entire batch.
The table below shows how first-pass yield moves the effective output multiplier, holding utilization and running hours constant.
| First-Pass Yield Rate | Saleable Output Multiplier | Rework Hours Consumed (relative) | Payback Effect vs 92% Base |
|---|---|---|---|
| 92 percent (fragmented manual control) | 0.92x | High | baseline (longest payback) |
| 94 percent | 0.94x | Medium-High | about 2 percent shorter |
| 96 percent | 0.96x | Medium | about 4 percent shorter |
| 98 percent (full automatic, closed-loop) | 0.98x | Low | about 6.5 percent shorter |
The multiplier column understates the real effect. The rework hours consumed at 92 percent yield remove running hours from next year’s capacity, compounding the loss. A workshop that lifts yield from 92 to 98 percent typically shortens payback by 8 to 14 percent relative to the baseline once rework recovery is included, not the 6.5 percent the simple multiplier suggests. This is precisely why on-line color measurement, closed-loop feeder control, and adequate vacuum degassing are not quality luxuries but payback accelerators.
Dispersion Quality and the Hidden Yield Penalty
A separate yield dimension in masterbatch is dispersion quality. A batch that is within the color tolerance but shows pigment agglomerates at the final film thickness will be rejected by a film or fiber customer, and that rejection appears far downstream, after the masterbatch has been shipped and incorporated. Strong dispersion — achieved through correct kneading block placement, sufficient residence in the dispersive zone, and the right barrel temperature profile — protects against this late-stage loss. In fiber-grade and thin-film applications, a one-grade improvement in dispersion stability can remove an entire class of customer returns, and customer returns carry a yield penalty many times larger than an in-house screening reject.
Product Mix and the Conversion Margin Index
The product mix decision converts physical output into return, and it is where many workshops make a strategic error. The intuition that “high-value products pay back fastest” is only partly true, because high-value products in masterbatch are usually the lower-throughput products. The optimization target is the weighted conversion margin index per running hour, not the headline index of any single category.
Consider a workshop that can run either a high-filler masterbatch at Very High throughput with an index of 100, or a fiber-grade color masterbatch at Low throughput with an index of 600. In one running hour, the filler line may produce three to four times the mass of the fiber line. Multiplying mass by index, the filler hour yields roughly 300 to 400 index-points of conversion margin, while the fiber hour yields roughly 600 index-points. The fiber hour wins, but only by a factor of about 1.5x to 2.0x, not by the 6x the raw index implies. A balanced mix that captures the throughput of fillers and the margin of colors typically outperforms a pure strategy at either extreme.
| Mix Strategy | Throughput Profile | Weighted Margin Index / Hour | Relative Payback Speed | Commercial Risk |
|---|---|---|---|---|
| 100 percent filler masterbatch | Very High | 100 | 1.00x (reference, slowest margin capture) | High (price-competitive commodity) |
| 100 percent high-concentration color | Low | 300 to 420 | 1.4x to 1.9x | Medium (needs color-match capability) |
| 100 percent functional masterbatch | Low to Medium | 400 to 700 | 1.5x to 2.2x | Medium-High (technical support burden) |
| Balanced 50 percent color / 30 percent filler / 20 percent functional | Medium | 320 to 460 | 1.6x to 2.0x | Low (demand diversification) |
The balanced mix in the final row is usually the most robust payback strategy. It captures a strong margin index per running hour while spreading commercial risk across categories whose demand cycles are not perfectly correlated. A workshop dependent on a single commodity filler product is exposed to a price war; a workshop dependent on a single high-end functional grade is exposed to the loss of one key account. Diversification on the output side behaves like diversification in any investment.
Mix Flexibility as a Machine Selection Constraint
The product mix also constrains machine selection in the opposite direction. A line designed only for high-filler masterbatch can be optimized with a short dispersive zone and a large feed throat, but it will struggle with a shear-sensitive fiber-grade color masterbatch that needs gentle conveying and a long, gentle mixing zone. A line designed for the broadest mix needs a configurable screw platform — interchangeable kneading blocks, optional side feeding, and a flexible barrel with plug-in exhaust sections — which is exactly what the Kerke KTE platform provides. The cost of that flexibility is a small increase in the investment index, but it expands the addressable mix and therefore the utilization the workshop can realistically achieve.
The Ramp-Up Curve and the True Payback Start Point
The most systematically ignored factor in masterbatch workshop payback is the ramp-up curve. A payback period calculated from the date of machine handover overstates risk and understates the true recovery speed, because the line does not produce at planned rate from day one.
A realistic project passes through four phases:
- Installation and commissioning — the barrel is installed, utilities are connected, the control system is configured, and the line is verified empty. Output is zero and the investment clock is already running.
- Trial production — the first formulations are run, parameters are stabilized, and operators learn the line. Capacity achievement is Low, typically 20 to 40 percent of planned rate, and yield is below target.
- Ramp-up — the line reaches Medium to High capacity achievement with improving yield as recipes mature and the team gains consistency.
- Stable production — the line runs at the planned capacity achievement and yield band, and this is the phase in which payback actually accrues.
| Phase | Typical Duration | Capacity Achievement | Yield Rate | Payback Contribution |
|---|---|---|---|---|
| Installation and commissioning | 1 to 2 months | 0 percent | n/a | Investment only, no return |
| Trial production | 1 to 2 months | 20 to 40 percent | 80 to 88 percent | Small, below break-even |
| Ramp-up | 2 to 4 months | 60 to 85 percent | 90 to 95 percent | Building toward break-even |
| Stable production | ongoing | 88 to 96 percent | 96 to 99 percent | Full payback accrual |
The combined pre-stable period typically spans four to nine months. A payback model that starts counting from handover is therefore pessimistic by the return of roughly the first half-year to three-quarters of a year. The correct approach is to set the payback start point at the beginning of stable production, and to report the pre-stable period separately as a commissioning phase. This does not change the total investment, but it reports the recovery window honestly and aligns the calculation with when the line genuinely begins to repay.
Two practical implications. First, choose a supplier whose commissioning is fast and whose recipe support is strong, because the duration of the trial and ramp-up phases is highly dependent on supplier expertise. Second, stage the product introduction: begin with the formulation the supplier has already run successfully, then expand the mix once stable production is established, rather than attempting the hardest grade on day one.
KTE Series Twin Screw Extruder: Machine Size and Payback
Machine size and torque grade set the ceiling on output per running hour, and therefore the upper bound of what any utilization and yield combination can deliver. The Kerke KTE Series Twin Screw Extruder is a family of parallel co-rotating machines spanning KTE-16B for laboratory scale up to KTE-135D for high-capacity industrial workshops, with rated output starting at 30 kilograms per hour and reaching well into the multiple-hundred kilograms per hour range for the larger sizes. Because the series is modular, aspect ratio, barrel structure, screw arrangement, exhaust configuration, feeding architecture, and electrical control can all be optimized to the intended product mix, which is exactly the flexibility a payback-driven buyer needs.
The screw diameter and torque grade of the selected model define single-machine capacity. A larger diameter raises throughput at a given screw speed, and a higher torque grade allows higher filler loading and higher screw speed before the torque limit is reached. In high-filler masterbatch, torque is usually the binding constraint, so a high-torque KTE model produces more per running hour than a standard-torque model of the same diameter — a direct payback advantage on high-filler formulations.
KTE Series Typical Specification Ranges
The values below are typical engineering ranges for the co-rotating KTE platform. Exact figures depend on the selected configuration and target formulation, and should be confirmed against a configuration proposal for a specific project.
| Model | Screw Dia. (mm) | L/D Range | Max Screw Speed (rpm) | Main Motor (kW) | Torque Grade |
|---|---|---|---|---|---|
| KTE-16B | 16 | 36 to 44 | up to 500 | 2.2 to 4 | Lab / High |
| KTE-35D | 35 | 40 to 48 | up to 600 | 15 to 37 | High |
| KTE-52D | 52 | 40 to 48 | up to 600 | 55 to 90 | High to Very High |
| KTE-65D | 65 | 40 to 48 | up to 600 | 90 to 160 | Very High |
| KTE-75D | 75 | 40 to 48 | up to 600 | 160 to 250 | Very High |
| KTE-95D | 95 | 40 to 48 | up to 600 | 250 to 450 | Very High to Premium |
| KTE-135D | 135 | 40 to 48 | up to 600 | 450 and above | Premium |
Typical Output Ranges by Masterbatch Type
The same machine produces very different rates depending on the product. The following ranges illustrate how throughput per running hour — the second payback curve — shifts across masterbatch categories on representative KTE sizes.
| Model | Color Masterbatch (kg/h) | Filler Masterbatch (kg/h) | Black Masterbatch (kg/h) | Vacuum Vents | Heating Zones |
|---|---|---|---|---|---|
| KTE-35D | 50 to 120 | 100 to 220 | 80 to 160 | 1 to 2 | 6 to 8 |
| KTE-52D | 150 to 350 | 300 to 650 | 250 to 450 | 1 to 2 | 8 to 10 |
| KTE-65D | 300 to 600 | 600 to 1,200 | 450 to 850 | 2 | 9 to 11 |
| KTE-75D | 500 to 900 | 1,000 to 2,000 | 750 to 1,400 | 2 to 3 | 10 to 12 |
| KTE-95D | 900 to 1,600 | 1,800 to 3,500 | 1,300 to 2,400 | 2 to 3 | 11 to 13 |
These ranges make the machine-size payback logic concrete. On a filler formulation, a KTE-65D can produce roughly double the mass per hour of a KTE-52D, which for a filler-dominant workshop directly halves the running hours needed to hit a given tonnage target. On a color formulation the same two machines are much closer, because the limiting mechanism is dispersion residence rather than torque. The correct machine size therefore depends on the product mix, not on a single headline throughput figure.
One Large Machine Versus Two Medium Machines
A recurring strategic question in workshop design is whether to install one large line or two medium lines of equivalent combined capacity. This choice has a direct and often underestimated effect on effective running hours and therefore on payback.
| Consideration | One Large Line (e.g. KTE-95D) | Two Medium Lines (e.g. 2x KTE-65D) |
|---|---|---|
| Investment index | Lower (economy of a single large unit) | Higher (duplicated auxiliaries) |
| Peak single-formulation throughput | Very High | High per line |
| Availability on breakdown | Low (one fault stops all output) | High (one line keeps running) |
| Changeover flexibility | Low (whole line stops to change shade) | High (alternate while one changes over) |
| Blended effective utilization | Medium | High |
| Best fit | Few formulations, long runs, filler-heavy mix | Many shades, frequent changeovers, color-heavy mix |
The trade-off is clear. One large line offers the lower investment index and the highest peak throughput, which suits a workshop running a few formulations in long campaigns. Two medium lines offer higher blended utilization and changeover flexibility because one line can keep producing while the other changes shade, which suits a color-heavy workshop with many short runs. For a mixed portfolio, the two-line configuration frequently delivers the faster real-world payback despite its higher investment index, precisely because it protects the effective running hours curve against both breakdowns and changeover stalls.
Length-to-Diameter Ratio and Its Payback Effect
The L/D ratio of the screws — commonly offered at 36:1, 40:1, 44:1, and 48:1 on the KTE platform — governs the residence time available for dispersion, distribution, and degassing. A longer L/D provides more mixing length and more space for multiple vacuum vents and side feeding, which raises the achievable filler loading and improves dispersion quality. For high-concentration color and functional masterbatch, a longer L/D lifts both throughput and yield. For simple filler masterbatch, a moderate L/D is often sufficient and avoids unnecessary residence that would only add specific energy consumption. Choosing L/D to match the mix is therefore a payback decision, not merely a technical preference.
| L/D Ratio | Best-Suited Products | Dispersion Capability | Degassing Capability |
|---|---|---|---|
| 36:1 | Simple filler masterbatch, basic compounds | Medium | Single vent |
| 40:1 | General color and filler, mixed workshop | High | Single to dual vent |
| 44:1 | High-concentration color, engineering compounds | Very High | Dual vent |
| 48:1 | Functional, biodegradable, reactive, high-fill fiber grade | Very High to Premium | Dual to triple vent |
KTE-SE Double-Stage and KTE-T Triple Screw Systems
Some formulations cannot be processed on a single-stage twin screw extruder at an acceptable yield, and forcing them onto the wrong machine is a hidden payback killer. Two specialized Kerke configurations exist precisely to protect yield and throughput on difficult materials.
KTE-SE Double-Stage Extrusion System
The KTE-SE Double-Stage Extrusion System is a mother-baby arrangement in which a first-stage twin screw extruder performs melting, mixing and dispersion, and a second-stage extruder handles low-temperature, low-shear conveying and pressure building for pelletizing. This separation is essential for heat-sensitive and highly filled formulations where a single machine cannot both disperse the material and pelletize it without overheating or over-shearing. For a workshop whose mix includes heat-sensitive biodegradable compounds or extremely high-filler grades, the double-stage system converts a formulation that would otherwise produce high reject rates on a single-stage line into a stable, high-yield product. In payback terms it lifts the yield curve and expands the addressable mix, both of which shorten recovery.
| Attribute | Single-Stage KTE | KTE-SE Double-Stage |
|---|---|---|
| Melt temperature control on heat-sensitive grades | Medium | Very High |
| Maximum filler loading capability | High | Very High |
| Yield on shear-sensitive formulations | Medium | High to Very High |
| Investment index | Lower | Higher |
| Best-fit products | General color, filler, black masterbatch | Biodegradable, ultra-high-fill, heat-sensitive compounds |
KTE-T Triple Screw Extruder
The KTE-T Triple (3 Screws) Extruder is a newer configuration that provides additional surface area and mixing geometry for specific difficult materials, offering advantages in dispersion and devolatilization for formulations that challenge conventional twin screw geometry. For a workshop whose payback strategy depends on capturing high-value functional and specialty grades, the triple screw configuration can be the enabling technology that makes those grades manufacturable at commercial yield. It should be selected only where the mix genuinely requires it, because its investment index is higher; for a standard color and filler workshop the KTE twin screw platform remains the more efficient payback path.
The general selection rule across these three platforms: choose the simplest configuration that achieves target yield on the intended mix. Over-specifying raises the investment index without a matching output gain; under-specifying depresses the yield curve on difficult grades. Both errors lengthen payback, and the correct answer is found by mapping the actual formulation portfolio onto the capability of each platform.
Specific Energy Consumption as a Hidden Payback Variable
Specific energy consumption, expressed in kilowatt-hours per kilogram of product, is the payback variable that hides inside the conversion margin. It does not appear in the throughput figure or the yield figure, yet it silently erodes the conversion margin index on every kilogram produced, and over a full operating year the cumulative effect is far from trivial.
Specific energy consumption in twin screw compounding is the sum of the mechanical energy delivered through the screws and the thermal energy delivered through the barrel heaters, minus any energy recovered. It varies strongly with formulation, screw configuration, screw speed, and throughput. Running a machine faster than its efficient window raises the mechanical energy per kilogram; running it far below its design rate raises the thermal energy per kilogram because barrel heating losses are spread over less output.
| Masterbatch Type | Typical Specific Energy (kWh/kg) | Main Energy Driver | Relative Margin Erosion |
|---|---|---|---|
| Calcium carbonate filler masterbatch | 0.12 to 0.22 | Torque to convey high solids loading | Medium |
| General color masterbatch | 0.18 to 0.32 | Dispersive mixing energy | Medium to High |
| Black masterbatch (high carbon black) | 0.25 to 0.42 | High shear to disperse carbon black | High |
| Functional / additives masterbatch | 0.20 to 0.40 | Formulation-specific mixing needs | Medium to High |
| Glass-fiber reinforced engineering compound | 0.22 to 0.38 | Melt viscosity and fiber feeding | Medium to High |
| Biodegradable compound (PLA / PBAT) | 0.20 to 0.36 | Low melt-temperature window, gentle mixing | Medium |
The way specific energy consumption feeds back into payback is through the conversion margin index. If a black masterbatch runs at the high end of its specific energy band because of an aggressive screw configuration, the extra energy per kilogram reduces the net conversion margin — the margin index falls even though the selling category is unchanged. A difference of 0.10 kilowatt-hours per kilogram between an efficient and an inefficient configuration on a high-volume grade, accumulated across a full year of continuous production, can move the effective conversion margin index by several percentage points, and therefore move the payback by a similar relative amount.
Two engineering choices control this. First, screw configuration: a screw designed to achieve the required dispersion with the minimum necessary shear avoids paying energy for mixing the material does not need. Second, operating point: running the machine within its efficient throughput and speed window, rather than at the extremes, keeps specific energy near the low end of the band. Both are addressed in the configuration proposal Kerke engineers prepare for a specific formulation portfolio, which is why matching the machine to the mix is an energy decision as well as a throughput decision.
Sensitivity Analysis of Five Payback Variables
A payback model is only useful if it can be stress-tested. Sensitivity analysis perturbs each input variable independently and reports the direction and relative magnitude of the effect on payback months. This reveals which variables deserve management attention and which are second-order. The table below perturbs five variables by plus or minus ten and twenty percent from a reference case and reports the relative change in payback months, with a positive number meaning a longer payback.
| Variable | -20% | -10% | Reference | +10% | +20% | Sensitivity Rank |
|---|---|---|---|---|---|---|
| Capacity utilization | +25% payback | +11% payback | 1.00x | -9% payback | -17% payback | 1 (highest) |
| Conversion margin index (product mix) | +24% payback | +11% payback | 1.00x | -9% payback | -16% payback | 2 |
| Shift pattern (running hours) | +22% payback | +10% payback | 1.00x | -8% payback | -15% payback | 3 |
| First-pass yield rate | +16% payback | +8% payback | 1.00x | -6% payback | -11% payback | 4 |
| Specific energy consumption | -4% payback | -2% payback | 1.00x | +2% payback | +5% payback | 5 (lowest) |
Three conclusions follow directly. First, capacity utilization and product mix are the two highest-leverage variables, and both are commercial rather than mechanical — they are decided by the order book and the sales strategy, not by the equipment specification. Second, shift pattern is the highest-leverage variable that is fully under operational control, which is why designing for continuous operation matters so much. Third, specific energy consumption, while real, is a second-order effect on payback compared with the output-side variables; it should be optimized, but it should never be optimized at the expense of yield or utilization.
A note on interpretation: the perturbations are not perfectly symmetric because payback is a reciprocal function of output. A twenty percent reduction in utilization lengthens payback by more than a twenty percent increase shortens it, which is the mathematical reason that protecting the downside — avoiding the low-utilization, low-yield failure modes — matters more than chasing the upside.
Key statistics in indexed terms: Baseline installed investment = 100 index points, of which the main extruder is 40 to 50. Moving utilization from 60 to 90 percent shortens payback by roughly 33 percent. Moving from two-shift to continuous three-shift operation makes payback roughly 2x faster. Raising first-pass yield from 92 to 98 percent shortens payback by 8 to 14 percent. Product mix conversion margin index ranges from 100 for filler masterbatch to 700 for functional grades, but margin per running hour compresses that spread to roughly 1x to 2.8x.
Application Industries and End Products
The payback of a masterbatch workshop is inseparable from the industries it serves, because each end market implies a product mix, a yield expectation, and a utilization pattern. Kerke twin screw extruders are engineered for the full breadth of masterbatch and compounding applications, and the mapping from industry to product to machine is where the payback model meets the market.
Kerke lines serve masterbatch production across all major categories: color masterbatch for injection molded goods and blow molded packaging, filler masterbatch for woven bags and blown film, additives masterbatch for stabilization and processing aids, black masterbatch for pipes, films and cables, and textile color masterbatch for spun fibers where dispersion quality is critical. In plastic compounding, the same platform produces engineering plastic compounds, biodegradable plastics based on PLA and PBAT, cable compounds, PVC compounds, thermoplastic elastomers, and wood-plastic composites. The platform also handles R-PET flakes recycling and specialized food processing extrusion.
| Industry / End Product | Typical Masterbatch or Compound | Margin Index Class | Utilization Pattern |
|---|---|---|---|
| Woven bags, agricultural film | Filler masterbatch, white masterbatch | Low to Medium | High, long runs |
| Injection molded consumer goods | General color masterbatch | Medium to High | Medium, many shades |
| Pipes, cables, geomembrane | Black masterbatch, cable compound | Medium to High | High, long runs |
| Spun fibers, nonwovens | Textile color masterbatch | High to Very High | Medium, quality-critical |
| Automotive, electrical components | Glass-fiber reinforced engineering compound | High | Medium to High |
| Compostable packaging, single-use items | Biodegradable compound (PLA / PBAT) | High | Growing, seasonal |
| Recycled packaging, sheet | R-PET flakes compounding and pelletizing | Medium | High, feedstock-dependent |
Reading this table alongside the earlier conversion margin index table gives the buyer a practical planning tool. A workshop targeting spun fibers and functional grades will build its payback on margin index per running hour and must invest in dispersion capability and color-match discipline. A workshop targeting woven bags and film will build its payback on throughput and utilization and must invest in high-torque, high-filler capability. Most durable businesses combine both, which is why the configurable KTE platform is a better payback foundation than a single-purpose line.
Requirement to Model Selection Guidance
Selecting the right machine is the point at which the payback model becomes a purchase order. The following selection table maps target annual capacity, masterbatch type, filler ratio, and shift pattern onto a recommended KTE model, feeding configuration, and pelletizing method. It is a starting point for discussion, not a substitute for a configuration proposal against a specific formulation portfolio.
| Target Profile | Masterbatch Type | Recommended KTE Model | Feeding Configuration | Pelletizing Method |
|---|---|---|---|---|
| R&D and small trials | All types, formula development | KTE-16B (lab) | Loss-in-weight, micro side feeder | Air-cooled strand |
| Low annual capacity, many shades | General color masterbatch | KTE-35D | Multi-component loss-in-weight | Water-cooled strand |
| Medium capacity, high filler ratio | Filler masterbatch (70 to 80%) | KTE-52D or KTE-65D, high torque | Main plus twin-screw side feeder | Water ring die-face hot cutting |
| Medium capacity, black masterbatch | Black masterbatch (high carbon black) | KTE-52D or KTE-65D, long L/D | Loss-in-weight plus crammer feeder | Underwater or water ring hot cutting |
| High capacity, continuous shifts | Filler and black, long campaigns | KTE-75D or KTE-95D | Central feeding, twin side feeder | Underwater granulation |
| Quality-critical, fiber grade | Textile color masterbatch | KTE-52D, 44:1 or 48:1 L/D | High-accuracy loss-in-weight | Water ring hot cutting with fine screening |
| Heat-sensitive specialty | Biodegradable, functional compound | KTE-SE double-stage or KTE-T triple | Loss-in-weight plus liquid feeder | Underwater with crystallizing dryer |
The feeding column deserves attention because feeding architecture is often the difference between reaching and missing the throughput assumption in the payback model. A twin-screw side feeder raises the maximum filler loading that can be forced into the melt, which directly lifts the achievable rate on filler masterbatch. A crammer feeder densifies low-bulk-density powders such as carbon black so they can be fed at rate rather than bridging in the throat. A liquid feeder introduces liquid additives precisely without the pre-absorption step. Each of these matches a specific formulation challenge, and getting the match right is what allows the workshop to run at the rate the model assumes.
Common Miscalculations and Payback Risks
Most payback disappointments trace to a small set of recurring analytical errors, each of which inflates the expected output or deflates the expected investment in a way that only becomes visible after commissioning. Recognizing them in advance is the cheapest form of risk management available.
- Calculating from nameplate throughput alone. The most common error is multiplying nameplate kilograms per hour by 8,760 hours and dividing the investment by the result. This ignores running hours, utilization, and yield, and typically overstates output by 40 to 60 percent.
- Ignoring changeover and cleaning losses. A color workshop that plans many shades but budgets no changeover time will miss its output target by the entire changeover loss, which as shown earlier can equal a whole shift pattern over a year.
- Underestimating the formulation development period. A new functional or biodegradable grade may need weeks of recipe refinement before it runs at target yield. Budgeting zero development time pushes the real payback start well beyond the plan.
- Neglecting screw and barrel wear on abrasive fillers. High-filler and glass-fiber formulations wear screw elements and barrel liners, and worn elements lose throughput and dispersion quality. A workshop that does not budget wear-part replacement will see the throughput curve decay over the first years.
- Letting downstream screening or packing become the bottleneck. If the extruder is sized for High throughput but the dryer, screen, or packing station cannot keep pace, the whole line runs at the speed of its slowest element. The payback model must be balanced end to end, not just at the extruder.
- Insufficient electrical capacity. A transformer sized only for average load will trip or limit the line at peak, capping utilization below the plan. Electrical capacity should be sized for the peak of the intended mix, not the average.
- Inadequate building height and ventilation. Poor heat dissipation raises cooling load and can force rate reduction in hot months, while insufficient height complicates die-face pelletizing and central feeding. Both quietly cap the output curve.
Every one of these risks acts on the output side of the model, which is exactly where the sensitivity analysis showed the highest leverage. This is not a coincidence: the errors that matter most are the ones that touch the variables that matter most. A disciplined buyer treats the output-side assumptions with far more scrutiny than the investment-side quotation, because a ten percent error in output moves the payback more than a ten percent error in price.
Engineering Levers That Accelerate Payback
Once the risks are understood, the corresponding engineering levers become clear. Each of the following measures acts directly on one of the three payback curves, and together they represent the practical toolkit for compressing the recovery window.
- Targeted screw configuration. Configuring dispersive kneading blocks for pigment and carbon black dispersion, and distributive elements for filler and additive homogenization, achieves the required quality at the minimum necessary shear. This lifts yield and holds specific energy near the low end of its band.
- Optimized side-feed position. Placing the side feeder at the correct axial position raises the maximum filler loading and stabilizes feeding, which lifts throughput on high-filler grades without a larger main motor.
- Adequate vacuum degassing. Correctly sized and positioned vacuum vents remove moisture and volatiles that would otherwise cause voids and surface defects, protecting the yield curve on hygroscopic and volatile-containing formulations.
- Quick-change barrel and screw elements. Split-barrel designs and quick-release screw shafts shorten the physical portion of deep cleaning, recovering running hours on a color-heavy mix with frequent changeovers.
- On-line detection to reduce rework. On-line color measurement, moisture monitoring, and melt pressure trending catch drift before it becomes a rejected batch, converting a yield loss into a minor adjustment.
- Preventive maintenance discipline. Scheduling wear-part inspection and replacement into planned windows keeps unplanned downtime in the target band and prevents the throughput decay that abrasive fillers otherwise cause.
- Production sequencing. Ordering campaigns from light to dark and grouping compatible carriers reduces average changeover time with no capital spending at all — the highest-return lever available.
Notice that several of these levers cost little or nothing and yet act on the highest-leverage variables. Production sequencing and preventive maintenance are management disciplines rather than capital investments, and both lift the running hours curve. This is the practical meaning of the finding that payback is a curve, not a number: the same physical workshop can live on a fast-payback curve or a slow one depending on how it is configured and run, and much of that difference is decided by engineering and management choices rather than by the size of the initial check.
Service, Support and Guarantees
The supplier’s service model has a direct and often decisive effect on the payback curve, because it governs the length of the ramp-up phase and the height of the effective running hours curve for years afterward. Kerke, a Wanplas factory, structures its service around exactly the phases that determine payback: fast commissioning, high sustained availability, and strong recipe support.
Before shipment, every line undergoes trial running with material, and the buyer is welcome to attend the factory acceptance test to verify performance on representative formulations before the equipment leaves the plant. This pre-shipment trial shortens the trial-production phase on site, because parameters established at the factory transfer directly to the workshop through the recipe management system. On arrival, Kerke engineers perform on-site installation and commissioning, which further compresses the pre-stable period that the ramp-up analysis identified as the true payback start point.
As a Wanplas factory, Kerke shares the group service commitments. These include a USD 500 free parts allowance every year, free replacement of parts damaged within the warranty period, a spare parts program covering screw elements and barrel liners, formulation and process training, remote operation and maintenance support, an open-factory policy welcoming customer visits, transportation guarantee, production capacity guarantee, and quality assurance that provides a refund plus 10 percent compensation if agreed quality standards are not met. The screw element and barrel liner spare-parts program is particularly relevant to payback on abrasive formulations, because it allows the workshop to replace worn wear parts before throughput decays rather than after.
| Service Element | Payback Curve Affected | Effect |
|---|---|---|
| Pre-shipment trial with material and buyer acceptance | Ramp-up duration | Shortens trial-production phase |
| On-site installation and commissioning | Ramp-up duration | Moves the payback start point earlier |
| Screw element and barrel liner spare program | Effective running hours; throughput | Prevents throughput decay on abrasive fillers |
| Formulation and process training | Yield rate | Lifts first-pass yield during ramp-up and beyond |
| Remote operation and maintenance support | Effective running hours | Reduces unplanned downtime duration |
| USD 500 free parts per year and warranty replacement | Effective running hours | Keeps availability high in early operating years |
| Production capacity and quality guarantee | Utilization; yield rate | De-risks the output-side assumptions |
The pattern in this table reinforces the central argument of the guide. Every meaningful service element maps onto one of the three payback curves. A supplier that only sells a machine leaves the buyer to defend those curves alone; a supplier whose service is designed around them shares the responsibility for the payback outcome. This is what specialization in compounding extrusion means in practice, and it is why the choice of supplier belongs inside the payback model rather than outside it.
All Kerke equipment is built to recognized international standards, and standards such as CE and ISO are referenced as plain engineering benchmarks rather than marketing claims. Buyers requiring specific standard compliance for their destination market should confirm the applicable requirements during the configuration discussion so that the specification is correct from the outset.
Frequently Asked Questions
What is the single biggest driver of payback period in a twin screw masterbatch workshop?
Capacity utilization is the dominant driver. Moving sustained utilization from 60 percent to 90 percent raises annual saleable output by roughly 50 percent, which compresses the payback window by roughly one third. Because utilization depends on the order book and sales reach rather than on equipment specification, it is also the variable most within the owner’s control. No single machine specification delivers a comparable effect, which is why serious buyers forecast utilization before finalizing machine size.
When should the payback clock start counting?
The payback clock should start at the beginning of stable production, not at machine handover. Installation and commissioning, trial production, and ramp-up together typically consume four to nine months, during which capacity achievement climbs from zero to a stable plateau and yield rises to its target band. Counting from handover overstates the recovery window by the return of that entire pre-stable period, so the two phases should be reported separately for an honest calculation.
How much does yield rate affect payback months?
Raising first-pass yield from 92 percent to 98 percent increases saleable output by about 6.5 percent directly, and it simultaneously frees the running hours that rework had consumed. Once the recovered rework hours are included, the combined effect commonly shortens payback by 8 to 14 percent relative to the baseline. This is why on-line color measurement, closed-loop feeder control, and adequate vacuum degassing behave as payback accelerators rather than as quality luxuries.
Is one large extruder or two medium extruders better for payback?
It depends on the product mix. One large line offers a lower investment index and the highest peak throughput, which suits a workshop running a few formulations in long campaigns, typically filler-heavy. Two medium lines offer higher blended utilization and changeover flexibility because one line keeps producing while the other changes shade, which suits a color-heavy workshop with many short runs. For a mixed portfolio the two-line configuration often delivers the faster real-world payback despite its higher investment index, because it protects the effective running hours curve against both breakdowns and changeover stalls.
How does specific energy consumption affect the payback calculation?
Specific energy consumption, measured in kilowatt-hours per kilogram, erodes the conversion margin on every kilogram produced. It varies by product from roughly 0.12 to 0.22 for filler masterbatch up to 0.25 to 0.42 for high-carbon-black masterbatch. A difference of 0.10 kilowatt-hours per kilogram between an efficient and an inefficient screw configuration on a high-volume grade, accumulated over a year of continuous production, can move the effective conversion margin index by several percentage points. It is a genuine but second-order variable and should be optimized without sacrificing yield or utilization.
Why is nameplate capacity a poor basis for payback estimation?
Nameplate capacity describes peak stable output on an ideal formulation, not the annual average across a real operating year. Multiplying nameplate kilograms per hour by all 8,760 calendar hours ignores shift pattern, holidays, changeovers, cleaning, unplanned downtime, formulation-specific rate derating, and yield loss. After applying these factors, annual saleable output commonly corresponds to the equivalent of 3,000 to 4,600 full-rate hours rather than 8,760, so a nameplate-based estimate can overstate output by 40 to 60 percent.
Does automation always shorten the payback period despite the higher investment?
In most masterbatch workshops it does, provided utilization is reasonable. Full automation cuts shift headcount by roughly 60 percent, shortens changeover time by roughly 65 percent, and lifts the first-pass yield band by four to six percentage points. Two of those three effects act directly on the output curves rather than only on operating cost, so the higher investment index is usually offset by faster and more consistent output. The exception is a workshop with very low utilization, where the extra automation capacity sits idle and the investment is harder to recover.
How does product mix change the machine I should buy?
A filler-dominant mix is limited by torque and feed volume, so it favors a high-torque model with a twin-screw side feeder and a moderate L/D. A color and functional mix is limited by dispersion residence and shear history, so it favors a longer L/D with more mixing length and multiple vacuum vents. A broad mix requires a configurable screw platform such as the KTE series, which accepts interchangeable kneading blocks, optional side feeding, and flexible barrel sections. Matching the machine to the mix expands the addressable market and therefore the utilization the workshop can realistically achieve.
Conclusion
The calculated payback period of a full automatic twin screw masterbatch manufacturing workshop is best understood not as a single number but as the outcome of three interacting curves — effective running hours, output per running hour, and first-pass yield rate — scaled by the conversion margin index of the actual product mix. Modeling it correctly means separating the investment layer, the output layer, and the conversion margin layer, expressing each in indexed and relative terms, and stress-testing the whole with a sensitivity analysis. The sensitivity analysis returns a clear priority order: capacity utilization and product mix lead, shift pattern is the highest-leverage operational lever, yield rate follows closely, and specific energy consumption is a real but second-order effect. Above all, the payback clock should start at stable production, after the four-to-nine-month commissioning and ramp-up period, not at machine handover.
These principles convert directly into equipment decisions. Machine size and torque grade set the throughput ceiling; L/D and screw configuration set dispersion quality and energy efficiency; the one-large-versus-two-medium choice trades investment index against blended utilization; and feeding and pelletizing architecture determine whether the workshop actually reaches the rate the model assumes. The Kerke KTE Series Twin Screw Extruder, together with the KTE-SE double-stage and KTE-T triple screw systems, provides the configurable platform on which a payback-optimized workshop is built, backed by the specialization of a factory that has focused on compounding extrusion for more than 12 years, with over 2,000 machines running in more than 70 countries.
To turn this model into a concrete configuration for your project, share your target masterbatch types, carrier resins, pigment or filler loading ratios, intended shift pattern, and annual capacity target. Kerke, a Wanplas factory, will return a tailored screw combination, feeding and pelletizing configuration, and a production line layout matched to your product mix and payback objectives. You are also warmly invited to bring your own material to the factory for a trial run and to visit and audit the plant before you commit, so that the payback curve your workshop will live on is verified before the first machine ships.