Why Color Masterbatch Profit Is an Engineering Result
The annual profit of a color masterbatch operation is not decided in the sales office. It is decided inside the barrel of the co-rotating twin screw extruder, at the loss-in-weight feeders, at the screen changer, at the pelletizing head, and above all in the production schedule that determines how many times a day the line has to be cleaned out for a new color. Every one of those points can be measured in physical units, and every one of them translates directly into tonnes produced, tonnes sold and tonnes scrapped. That is why this analysis treats profitability as an engineering variable rather than a commercial negotiation.
Throughout this article, cost and profit are expressed only in percentage shares, in index points against a revenue baseline of 100 index points, in relative grades from Low to Premium, and in physical quantities such as kilograms, tonnes and kilowatt-hours. Deliberately, no currency figures, unit prices or absolute monetary values appear anywhere. Pigment grades, carrier resins, electricity tariffs and labor rates differ by region, by contract and by year to such a degree that any absolute figure would be misleading within months. What does not change is the physics of dispersive mixing, the arithmetic of overall equipment effectiveness, and the shape of the cost structure. Those are transferable, and those are what a plant manager can act on.
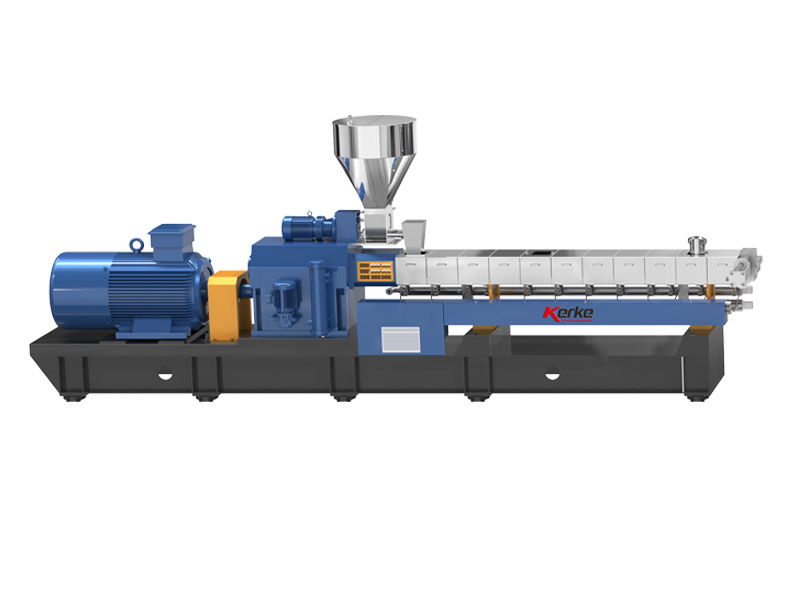
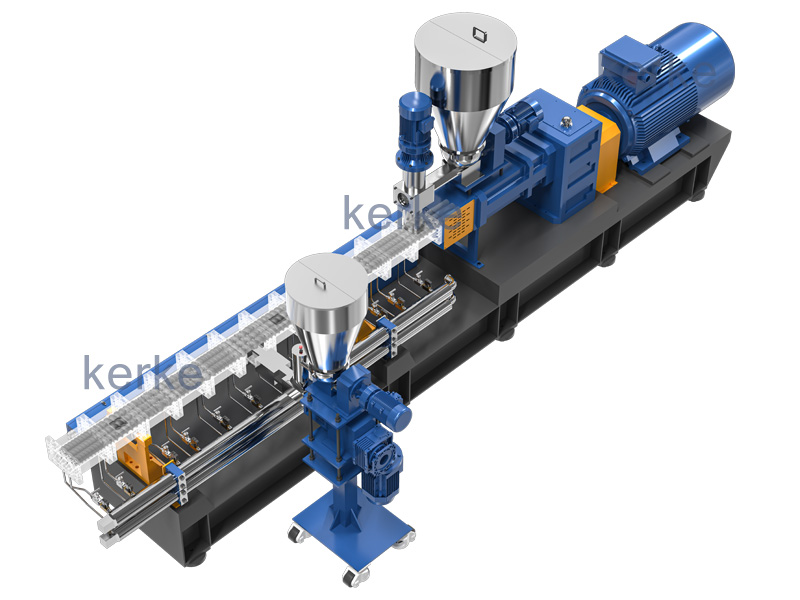
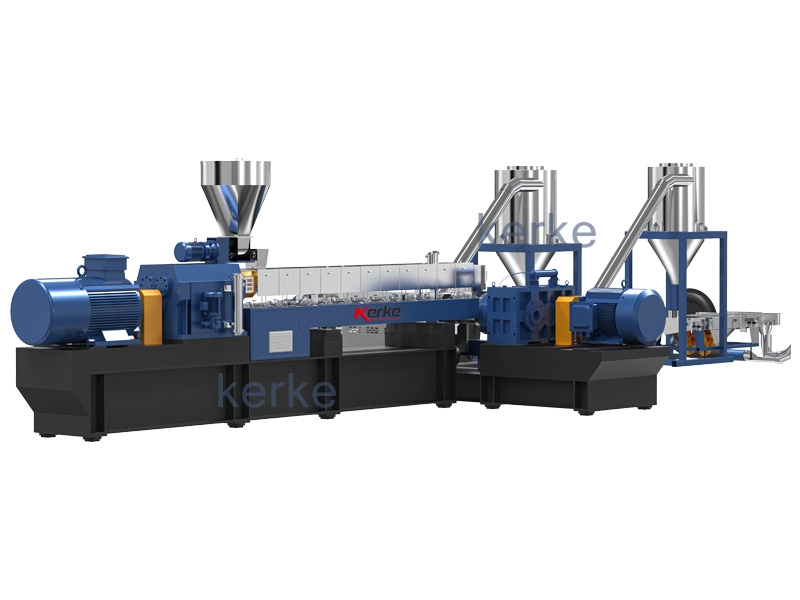
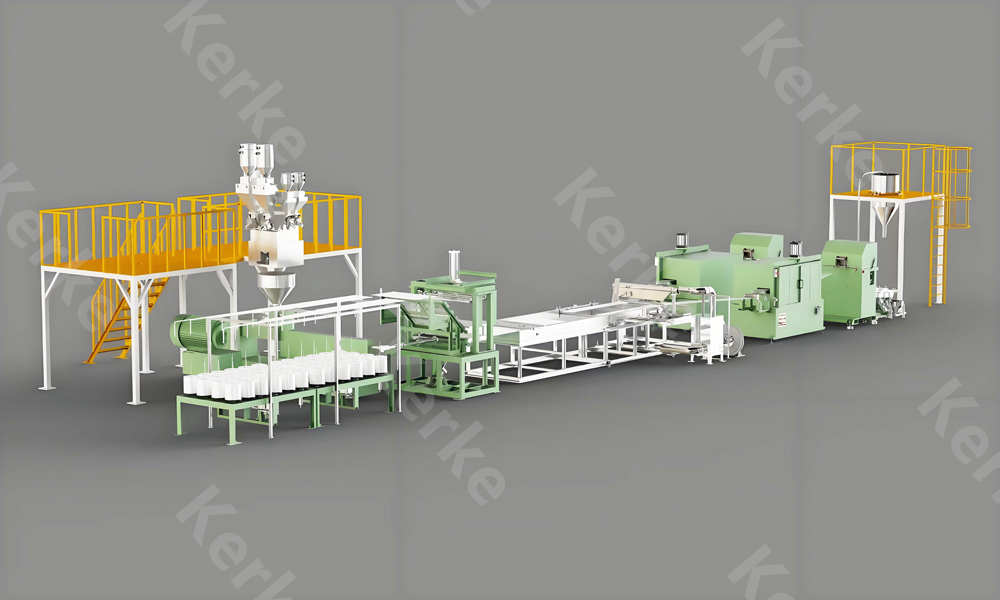
Kerke, a Wanplas factory specializing in co-rotating parallel twin screw compounding extruders, has supplied masterbatch compounding lines to more than 70 countries, with over 2,000 machines running worldwide from a factory of nearly 20,000 square meters and more than 12 years of dedicated compounding experience. The engineering observations in this article are drawn from that installed base of KTE series machines, which run from the KTE-16B laboratory unit through mid-range production models up to the KTE-135D. The Wanplas brand, which is the parent of Kerke and six further specialized machinery factories, applies the same technical documentation and after-sales discipline across its network, and that consistency matters when a compounder wants comparable performance data from several lines in one plant.
The structure of the analysis follows the money as it flows through the process. Sections two through five deal with the output side: how many saleable kilograms actually leave the plant per year, and why the theoretical nameplate capacity is never achieved. Sections six through eight deal with the cost side: how the total cost divides between raw material, energy, labor, depreciation, maintenance and logistics, and how energy and wear behave as engineering functions rather than fixed overheads. Sections nine and ten deal with the revenue side: how product mix sets the gross margin gradient, and how three annual output scenarios compare when everything is normalized to index points. Section eleven converts the whole analysis into twelve measures that a plant can implement without changing its equipment base.
The profitability of a color masterbatch plant is governed by five measurable engineering quantities: overall equipment effectiveness, color changeover loss, dispersion quality expressed as filter pressure value, specific energy consumption, and wear part life. A plant that manages these five well will outperform a plant that only negotiates hard on purchasing, because four of the five multiply the tonnage over which every fixed cost is spread.
Overall Equipment Effectiveness: The Master Multiplier
Overall equipment effectiveness, usually abbreviated OEE, is the single most powerful number in a masterbatch profit model because it multiplies directly into annual tonnage, and annual tonnage divides into every fixed cost. In color masterbatch compounding the realistic industry band is 72 to 88 percent, formed from availability of 85 to 93 percent, performance rate of 88 to 96 percent and quality rate of 96 to 99.5 percent. The spread between the bottom and the top of that band is worth more to annual profit than almost any purchasing initiative.
Availability measures the share of planned production time during which the line is actually running. In a color masterbatch plant the dominant availability losses are color changeovers, screen pack replacement, pelletizer knife adjustment, feeder refilling and unplanned faults such as strand breakage or die freeze. A plant running long campaigns of white or black masterbatch will sit near 93 percent because it changes color rarely. A custom color house serving injection molders with lot sizes of a few hundred kilograms will struggle to hold 85 percent, because the changeover frequency alone can absorb two hours of every shift.
Performance rate measures how close the running line comes to its rated throughput. Losses here are subtle and frequently invisible on the shift report. Worn screw elements and an enlarged radial clearance reduce conveying efficiency. A partially blocked screen pack raises head pressure and forces the operator to reduce feed rate. A pigment with poor flow properties causes the loss-in-weight feeder to run below setpoint. Ambient humidity changes the bulk density of a filler and the volumetric feeder silently under-delivers. Each of these takes two to five percent off the rated output, and together they explain why performance rate rarely exceeds 96 percent even on a well-maintained line.
Quality rate measures the share of produced material that is saleable at full grade. In color masterbatch the tolerance is unusually tight because the customer judges the product visually. A color difference of more than 1.0 in the standard color difference scale is normally rejected for consumer-visible parts, and black specks in a light-colored masterbatch cause rejection regardless of any other property. Quality rate of 99.5 percent is achievable on a stable, dedicated grade; 96 percent is more typical for a plant that runs many new color matches with short campaigns.
Table 1: OEE composition and industry banding for color masterbatch lines
| OEE component | Weak band | Industry typical | Best-in-class | Dominant loss drivers |
|---|---|---|---|---|
| Availability | 78 to 84 percent | 85 to 90 percent | 91 to 93 percent | Color changeover, screen pack change, feeder refill, strand break, die freeze |
| Performance rate | 80 to 87 percent | 88 to 93 percent | 94 to 96 percent | Screw element wear, screen blockage, feeder under-delivery, bulk density drift |
| Quality rate | 93 to 95 percent | 96 to 98.5 percent | 99 to 99.5 percent | Color difference above 1.0, black speck, pellet size scatter, moisture above 0.1 percent |
| Resulting OEE | 58 to 69 percent | 72 to 82 percent | 85 to 88 percent | Product of the three components above |
Converting OEE into annual tonnage
The arithmetic that turns OEE into tonnes is deliberately simple, and every plant should have it written on the production office wall. Annual saleable output in kilograms equals the nominal throughput in kilograms per hour, multiplied by the planned operating hours per year, multiplied by OEE. A three-shift operation with one weekly maintenance day and normal holiday coverage plans roughly 7,000 to 7,800 operating hours per year out of the 8,760 calendar hours.
Take a mid-range co-rotating twin screw extruder rated at 500 kilograms per hour on a standard color masterbatch recipe, with 7,300 planned hours. At an OEE of 72 percent the line delivers 2,628 tonnes of saleable product per year. At an OEE of 88 percent the same machine, the same screw and the same recipe deliver 3,212 tonnes. The difference of 584 tonnes per year is produced with the same depreciation, largely the same labor and the same building. In the cost structure that follows in section six, this is the mechanism by which fixed cost per tonne falls, and it is why OEE improvement almost always outranks unit price negotiation on the list of profit levers.
The same arithmetic explains why capacity utilization and OEE must not be confused. A plant may hold an excellent OEE of 86 percent while only selling enough product to keep the line loaded 60 percent of the calendar year. In that case the machine performs well but the fixed cost per tonne remains high, because the divisor is order intake rather than technical performance. Section ten separates the two effects explicitly across the three output scenarios.
Color Changeover Loss: The Hidden Tax on Annual Tonnage
Color changeover is the defining economic feature of color masterbatch production and the reason a masterbatch plant behaves differently from any other compounding operation. Every time the recipe changes color, the barrel, the screw assembly, the screen changer, the die and the strand path must be cleared of the previous pigment, and everything discharged during that clearing is either downgraded or scrapped. Each changeover typically discharges 8 to 30 kilograms of purge material, and a plant serving custom colors performs 3 to 8 changeovers per day. Combined with the associated stoppage time, this removes about 2 to 6 percent of annual output.
The purge quantity is a function of the internal volume of the melt path and of the color contrast between the outgoing and the incoming product. A compact laboratory or small production extruder with a short die and a single screen changer can be cleared with 8 to 12 kilograms. A larger production line with a melt pump, a continuous screen changer, a long transition piece and a wide strand die holds far more melt and needs 20 to 30 kilograms, more if the transition is from a strong phthalocyanine blue to a pastel ivory. Self-cleaning kneading co-type screw geometry, which is characteristic of well-designed co-rotating twin screw machines including the Kerke KTE series, reduces the residual film on the flights and therefore reduces the purge quantity relative to a machine with poor conjugation.
The time component of changeover loss is usually larger than the material component, and it is far more often overlooked. A routine changeover within the same color family takes 15 to 25 minutes; a changeover from a dark saturated color to a light pastel, requiring mechanical cleaning of the screen changer and possibly a screw pull, takes 45 minutes to several hours. The production hours lost are hours in which the depreciation, the labor and the plant overhead continue to accrue while zero saleable kilograms are produced.
Table 2: Color changeover loss scenarios and their annual output impact
| Scheduling regime | Changeovers per day | Purge per changeover | Stoppage per changeover | Annual output loss |
|---|---|---|---|---|
| Random sequencing, mixed color families | 6 to 8 | 18 to 30 kg | 30 to 60 min | 4 to 6 percent |
| Partly grouped by customer, no color logic | 4 to 6 | 14 to 24 kg | 25 to 40 min | 3 to 4.5 percent |
| Grouped by color family, light to dark sequence | 3 to 5 | 10 to 18 kg | 15 to 30 min | 1.5 to 3 percent |
| Color family grouping plus dedicated screw sets | 3 to 4 | 8 to 14 kg | 12 to 22 min | 1 to 2 percent |
Work through the arithmetic for a line rated at 500 kilograms per hour. Under random sequencing with 6 changeovers per day, 24 kilograms of purge each and 40 minutes of stoppage each, the plant discharges 144 kilograms of purge per day and stands still for 4 hours per day. Over 330 production days that is 47.5 tonnes of purge and 1,320 lost hours, and those lost hours would have produced a further 660 tonnes. Under color family grouping with 4 changeovers, 12 kilograms and 20 minutes each, the same plant discharges 15.8 tonnes of purge per year and loses 440 hours, equal to 220 tonnes of forgone production. The scheduling change alone recovers well over 400 tonnes of annual capacity from equipment that has not been modified in any way.
Three engineering practices reduce changeover loss further. First, sequence from light to dark within a color family so that residual pigment from the previous run is tolerated by the incoming darker product, which converts most transitions into zero-scrap transitions. Second, use a purging compound with a high melt viscosity and a mechanical scouring filler rather than simply pushing the next production recipe through, because a proper purge compound clears the melt path with roughly half the material. Third, keep a second screw assembly and a second screen changer bowl prepared off-line, so a difficult transition becomes a mechanical swap of 20 minutes rather than a two-hour clean-in-place operation. The third measure applies mainly to plants above roughly 3,000 tonnes per year, where the changeover frequency justifies the duplicate hardware.
Pigment Dispersion, Formulation Efficiency and Filter Pressure Value
Dispersion quality is where the engineering of the twin screw extruder converts directly into the price grade the product can command. A color masterbatch whose pigment is fully deagglomerated can be sold at a higher letdown ratio, runs on the customer’s thin-film or fine-denier fiber line without screen blockage, and produces a consistent color at a lower pigment loading. A masterbatch with residual agglomerates forces the customer to dose more, blocks their melt filter, and eventually loses the account. The industry quantifies this with the filter pressure value, measured according to DIN EN 13900-5, where a premium color masterbatch holds a filter pressure value at or below 0.5 bar per gram per square centimeter.
Pigment concentration and carrier system
Color masterbatch is normally formulated at a pigment concentration of 20 to 60 percent, with the balance made up of carrier resin, dispersant and process additives. Organic pigments, which are strongly colored but hard to wet and deagglomerate, are usually held at 20 to 40 percent. Inorganic pigments and titanium dioxide, which are easier to disperse but require higher loading for opacity, run at 50 to 60 percent and in dedicated white masterbatch can exceed 70 percent. The higher the loading, the higher the melt viscosity, the higher the specific mechanical energy needed, and the more the screw configuration must be biased toward dispersive rather than distributive mixing.
The carrier resin is not a passive diluent. Polyethylene wax carriers have very low melt viscosity, wet pigment surfaces rapidly and allow very high pigment loading, but they soften the final pellet and can migrate in the customer’s part, so they are typically used as a co-carrier at 3 to 10 percent rather than as the whole matrix. Ethylene vinyl acetate carriers offer excellent pigment wetting because of the polar acetate group, tolerate high loading, and remain broadly compatible with polyolefin end-use, which makes them a workhorse for universal color masterbatch. Polypropylene carriers give the best compatibility and mechanical retention when the end use is polypropylene fiber, injection molding or thermoforming, but they demand more dispersive shear because the melt viscosity is higher and pigment wetting is slower. Dispersant, typically a metal stearate, a polymeric wetting agent or a fatty acid derivative, is added at 0.5 to 3 percent and is the cheapest single lever on filter pressure value.
Screw configuration, L/D and the mechanics of deagglomeration
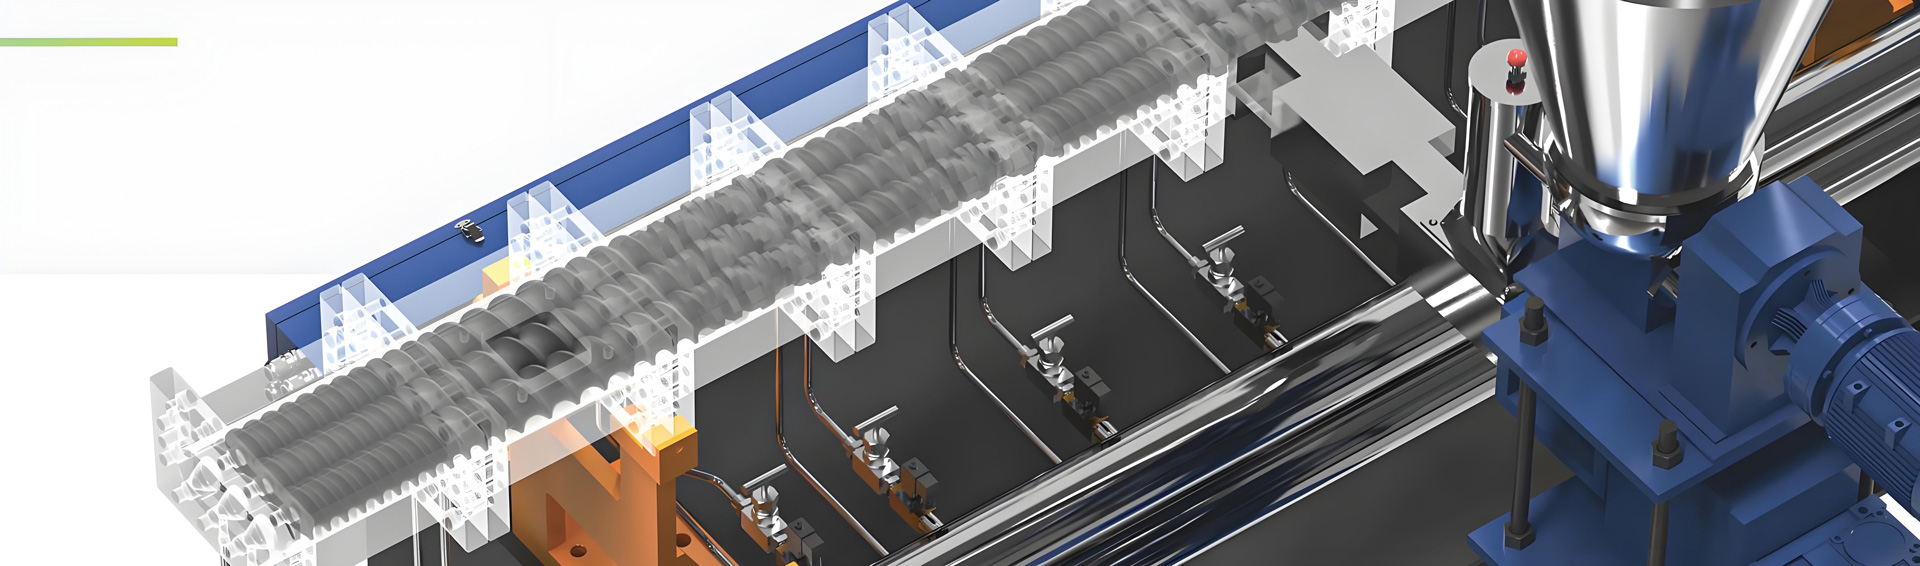
A co-rotating parallel twin screw extruder disperses pigment through a combination of elongational flow at the entry to a kneading block, shear in the gap between the kneading disc tip and the barrel wall, and repeated reorientation of the melt between blocks. The configuration variables that matter are the length-to-diameter ratio, the number and position of the kneading zones, the offset angle of the kneading discs, and the use of left-handed elements to build a melt seal and increase residence time locally.
For color masterbatch a length-to-diameter ratio of 44 to 52 to 1 is the practical working range. Below 40 to 1 there is insufficient length to fit a pigment wetting zone, two dispersive zones, a devolatilization zone and a pressure building zone in sequence, and dispersion quality suffers at any reasonable throughput. Above 52 to 1 the residence time grows long enough that heat-sensitive organic pigments begin to shift shade, and the machine consumes more energy per kilogram than the dispersion benefit justifies. Within that range, the standard architecture places a 30-degree forward kneading block immediately after the melting zone for gentle wetting, a 60-degree block for intensive dispersion, a 90-degree neutral block plus a short left-handed element to build the melt seal ahead of the vacuum vent, and a final distributive section of narrow-disc or gear-type mixing elements to homogenize before the die.
Kneading block selection is where dispersion is won or lost. A 30-degree forward block conveys while it mixes and gives a low residence time with moderate shear, appropriate for easily dispersed inorganic pigments and for heat-sensitive organic pigments that would degrade under intensive shear. A 60-degree block gives the highest ratio of dispersive to distributive action and is the standard tool for breaking down organic pigment agglomerates. A 90-degree neutral block neither conveys nor pumps, holds the melt in a fully filled state, and provides the longest local residence time, which is effective but must be used sparingly because it also generates the most shear heat. Excessive 90-degree content is a common cause of shade shift in red and yellow organic pigments and can undo the dispersion benefit by thermally degrading the very pigment it is dispersing.
Table 3: Carrier systems, pigment loading and typical filter pressure value bands
| Carrier system | Typical pigment loading | Dispersion difficulty | Typical filter pressure value | Preferred application |
|---|---|---|---|---|
| Polyethylene wax co-carrier with polyolefin base | 50 to 70 percent | Low | 0.2 to 0.6 bar per gram per square centimeter | White and filler-rich masterbatch, film and sheet |
| Ethylene vinyl acetate carrier | 40 to 60 percent | Low to Medium | 0.3 to 0.8 bar per gram per square centimeter | Universal color masterbatch for polyolefin conversion |
| Polypropylene carrier, homopolymer or random copolymer | 25 to 45 percent | Medium to High | 0.4 to 1.2 bar per gram per square centimeter | Polypropylene fiber, injection molding, thermoforming |
| Polyethylene carrier with organic pigment package | 20 to 35 percent | High | 0.5 to 1.5 bar per gram per square centimeter | High-chroma colors, thin film, blown film |
| Engineering resin carrier such as polyamide or polyester | 20 to 40 percent | Very High | 0.6 to 1.8 bar per gram per square centimeter | Fiber spinning, engineering plastic coloring |
The reason filter pressure value belongs in a profit analysis rather than only in a quality manual is that it sets the product’s market tier. A masterbatch at or below 0.5 bar per gram per square centimeter can be sold into fine-denier fiber spinning and thin blown film, applications where the converter’s melt filter is fine and the process is intolerant of agglomerates. Those applications reward the supplier with a Very High or Premium gross margin grade. A product at 1.2 to 1.8 bar per gram per square centimeter is confined to thick-wall injection molding and general-purpose applications, where competition is intense and the margin grade is Low to Medium. Two plants with identical extruders can therefore sit in completely different margin tiers purely because one has optimized screw configuration, dispersant level and carrier selection while the other has not.
A practical dispersion audit costs nothing but discipline. Sample the pellet at the die every two hours during a campaign, run the filter pressure test in the plant laboratory according to DIN EN 13900-5, and plot the value against screw speed, feed rate and melt temperature. Most plants discover that filter pressure value is minimized not at maximum screw speed but at an intermediate speed where the fill level in the kneading zones is highest. Running above that speed reduces the fill level, shortens residence time in the dispersive elements, and raises filter pressure value while also raising energy consumption. Finding this optimum typically improves both dispersion and specific energy consumption at the same time, which is the rare case where quality and cost move together.
Where Yield Is Lost: Black Speck, Color Difference, Pellet Shape, Moisture
Quality rate in a color masterbatch plant is the difference between 96 and 99.5 percent, and that 3.5 percentage point band decides whether the plant sits in the upper or lower half of its peer group. Four defect families account for the overwhelming majority of rejected material: black specks, color difference above the accepted tolerance, non-uniform pellet geometry, and residual moisture above 0.1 percent. Each has a distinct engineering root cause and a distinct remedy, and each behaves differently in the profit model because some defects can be reworked into darker grades while others must be discarded entirely.
Black speck contamination
Black specks are the most commercially damaging defect in light-colored masterbatch because they are visible to the end customer and cannot be reworked into anything except black or very dark grades. Their sources are degraded polymer trapped in dead spots of the melt path, carbonized material released from the screen changer during a pressure surge, carbon residue left from a previous black masterbatch campaign, metal wear debris from screw element contact, and contamination carried in with recycled or reclaimed feedstock. The engineering controls are a fully self-wiping screw geometry with no stagnation zones, a streamlined transition piece between the extruder and the die with no steps or cavities, disciplined screen replacement before the pressure differential grows large enough to release trapped char, and physical separation of black masterbatch campaigns onto a dedicated screw set or a dedicated line where volume allows.
A plant that has recurring black speck problems should measure rather than guess. Run a clean transparent carrier resin through the line for twenty minutes, collect the pellet, press a film of about 50 micrometers and count the specks per unit area under transmitted light. Repeat the test immediately after a screen change, immediately before a scheduled screen change, and after a mechanical screw cleaning. The three results identify whether the source is the screen pack, the melt path or the raw material, and each source has a different and non-interchangeable remedy.
Color difference
Color difference is quantified as the total color difference between the production sample and the approved standard, measured with a spectrophotometer under standardized illumination, with visual confirmation carried out according to ASTM D1729. For consumer-visible parts the normal acceptance limit is a total color difference of 1.0 or lower, tightening to 0.5 for critical applications such as automotive interior parts and matched multi-component assemblies. Exceeding the limit generates two kinds of loss: the material itself, which can sometimes be corrected by adding a small tint correction and reprocessing, and the delay while the correction is calculated and approved, during which the line either stands still or runs a different order.
The engineering causes of color drift are pigment dosing error at the loss-in-weight feeder, insufficient dispersion so that the effective color strength varies with residence time, thermal shift of heat-sensitive organic pigments when the melt temperature drifts upward, and cross-contamination from an incomplete changeover. Feeder accuracy is the most frequent cause and the easiest to fix, since a gravimetric feeder holding plus or minus 0.5 percent will keep a 30 percent pigment loading within a color strength band that is invisible to the eye, while a drifting feeder at plus or minus 2 percent will not.
Pellet geometry and moisture
Non-uniform pellet geometry is often dismissed as cosmetic, but it costs real output because the customer meters masterbatch volumetrically at the throat of their injection molding machine or extruder. If the pellet weight varies widely, the letdown ratio varies, and the customer sees color variation in parts that were produced from a perfectly good masterbatch. The controls are strand tension and strand cooling uniformity, pelletizer knife speed matched to strand haul-off speed, correct knife sharpness and clearance, and screening of fines and oversize before packing. A well-run strand pelletizing system holds pellet weight coefficient of variation at 3 to 5 percent; a neglected one drifts to 8 to 12 percent.
Residual moisture above 0.1 percent produces bubbles and silver streaking in the customer’s part and, in hygroscopic carriers such as polyamide or polyester, can cause hydrolytic degradation during letdown. Control comes from three places: pre-drying of hygroscopic raw materials before compounding, effective vacuum devolatilization at the extruder vent at roughly minus 0.08 to minus 0.095 megapascal gauge, and adequate dewatering and drying after water-bath strand cooling. A centrifugal dewatering unit followed by a hot air fluidized bed will bring surface moisture below 0.05 percent for polyolefin masterbatch, which provides a comfortable margin against the 0.1 percent limit.
Table 4: Yield loss sources, detection method and recoverability
| Defect family | Typical share of total rejects | Detection method | Recoverable | Primary engineering control |
|---|---|---|---|---|
| Black speck in light colors | 25 to 40 percent | Pressed film speck count under transmitted light | Only into black or very dark grades | Self-wiping screw, streamlined melt path, screen change discipline |
| Color difference above 1.0 | 30 to 45 percent | Spectrophotometer plus visual check per ASTM D1729 | Often, via tint correction and reprocessing | Feeder accuracy, dispersion stability, melt temperature control |
| Pellet size and shape scatter | 10 to 20 percent | Sieve analysis and pellet weight coefficient of variation | Usually, by re-screening or reprocessing | Strand tension, knife speed and sharpness, fines screening |
| Moisture above 0.1 percent | 5 to 15 percent | Karl Fischer titration or loss on drying | Yes, by re-drying | Pre-drying, vacuum devolatilization, dewatering and drying |
The recoverability column deserves attention because it changes the weight of each defect in the profit model. A moisture failure caught before packing consumes only drying energy and a handling operation. A color difference failure consumes a tint correction, a reprocessing pass and a second quality release, which together absorb roughly two to four times the original conversion effort of that batch but preserve the raw material. A black speck failure in a pastel color destroys the value of the pigment package entirely, since the material can only be absorbed into black grades at a small fraction of its original grade. This is why plants that measure their reject tonnage without classifying it by defect family systematically misjudge where to invest their improvement effort.
Annual Cost Structure Expressed in Percentages
The cost structure of a color masterbatch plant is dominated by one line item to a degree that surprises engineers arriving from other sectors of plastics processing. Raw materials, meaning pigment, carrier resin and additive package together, account for 68 to 82 percent of total production cost. Everything else, including all electricity, all labor, all depreciation, all maintenance and all packaging and logistics, shares the remaining 18 to 32 percent. Any improvement program that does not start from that asymmetry will allocate effort in the wrong proportion.
Table 5: Annual cost structure of a color masterbatch plant, share of total production cost
| Cost element | Share of total cost | Position within the band | Main variables that move it |
|---|---|---|---|
| Raw materials: pigment, carrier resin, additives | 68 to 82 percent | Upper end for high-chroma organic pigment colors; lower end for filler-rich and black grades | Pigment loading, dispersant efficiency, scrap rate, purge quantity, formulation design |
| Electricity | 4 to 8 percent | Upper end for high-viscosity engineering carriers and high pigment loading | Specific energy consumption, auxiliary load, tariff period scheduling, idle running |
| Labor | 5 to 9 percent | Upper end for many small lots with manual packing and manual color matching | Lot size, automation of packing and palletizing, shift pattern, changeover frequency |
| Depreciation | 4 to 8 percent | Upper end when capacity utilization is low | Annual tonnage, asset life assumption, number of parallel lines |
| Maintenance and spare parts | 2 to 4 percent | Upper end for abrasive filler and glass-fiber-bearing recipes | Screw and barrel liner life, screen consumption, pelletizer knives, gearbox service |
| Packaging and logistics | 3 to 6 percent | Upper end for export shipments in small sacks with individual labeling | Package size, palletizing automation, shipping distance, order fragmentation |
Sensitivity: which cost line rewards attention
Because the shares are so unequal, the same relative improvement produces very different absolute effects. A one percent relative reduction in raw material consumption, achieved for instance by cutting scrap or purge, moves total cost by roughly 0.68 to 0.82 percentage points. A ten percent relative reduction in electricity consumption, which is an ambitious energy project, moves total cost by only 0.4 to 0.8 percentage points. In other words, an entire successful energy efficiency program is roughly equivalent to a one percent improvement in material yield. This does not make the energy project worthless, but it does establish the sequence in which a plant should attack its cost base.
The second observation is that depreciation and a substantial portion of labor are fixed with respect to tonnage. They are expressed above as a share of total cost at a normal operating level, but per tonne they fall as output rises. This is the mechanism formalized in the scenario analysis of section ten, where unit fixed cost is shown to drop from about 20.5 index points of revenue at 2,000 tonnes per year to about 11.5 index points at 10,000 tonnes per year.
A third observation concerns maintenance. At 2 to 4 percent of total cost, maintenance looks like a candidate for reduction, and it is frequently the first budget cut when margins tighten. That is almost always a mistake in masterbatch compounding, because deferred maintenance does not stay contained within its own 2 to 4 percent. Worn screw elements reduce throughput, which raises the per-tonne share of every fixed cost. Delayed screen changes release char, which raises the black speck reject rate, which attacks the 68 to 82 percent raw material line. The correct framing is that the maintenance budget is a control lever on the two largest cost blocks, not a cost block in its own right.
Specific Energy Consumption and Annual Electricity Modeling
Specific energy consumption is the amount of electrical energy the main drive consumes per kilogram of product, and it is the correct engineering metric for the energy line of the cost structure because it is independent of plant size and directly comparable between machines. For color masterbatch produced on a co-rotating twin screw extruder the working band is 0.18 to 0.32 kilowatt-hours per kilogram. Highly filled calcium carbonate filler masterbatch runs lower, at 0.12 to 0.22 kilowatt-hours per kilogram, because the mineral filler requires distributive rather than intensive dispersive mixing and because the melt viscosity of the highly loaded polyolefin system is lower than that of a high-chroma organic pigment concentrate at equivalent throughput.
Table 6: Specific energy consumption bands by product type
| Product type | Main drive specific energy | Auxiliary uplift | Governing factor |
|---|---|---|---|
| Calcium carbonate filler masterbatch, 70 to 80 percent loading | 0.12 to 0.22 kWh per kg | 18 to 25 percent | Distributive mixing dominates; low melt viscosity |
| Black masterbatch with carbon black | 0.20 to 0.30 kWh per kg | 20 to 28 percent | High structure carbon black raises viscosity sharply |
| White masterbatch with titanium dioxide | 0.16 to 0.26 kWh per kg | 18 to 26 percent | Easy dispersion but very high loading |
| Standard color masterbatch, polyolefin carrier | 0.18 to 0.28 kWh per kg | 20 to 30 percent | Balance of dispersive shear and throughput |
| High-chroma organic pigment concentrate | 0.24 to 0.32 kWh per kg | 22 to 30 percent | Intensive dispersive mixing at controlled melt temperature |
How to build the annual electricity model
The annual electricity model is built in four steps and requires no special metering beyond a main drive power reading and a plant submeter. First, take the annual saleable tonnage from the OEE calculation of section two and multiply by 1,000 to obtain kilograms. Second, multiply by the specific energy consumption appropriate to the product mix to obtain the main drive energy in kilowatt-hours. Third, apply the auxiliary uplift, which covers the chiller, the vacuum pump, the vacuum conveying blowers, the dryers, the water bath circulation, the packaging line, the compressed air and the plant lighting and ventilation, and which in practice runs at 20 to 30 percent of the main drive figure for a compact, well-designed plant. Fourth, add the idle and standby energy, which is the energy consumed while the barrel heaters hold temperature during changeovers and short stoppages and which is often 3 to 6 percent of the total.
Worked as an example, a plant producing 5,000 tonnes per year of standard color masterbatch at 0.24 kilowatt-hours per kilogram consumes 1,200,000 kilowatt-hours at the main drive. Applying a 25 percent auxiliary uplift adds 300,000 kilowatt-hours, and a 4 percent idle allowance adds a further 60,000 kilowatt-hours, giving an annual total of approximately 1,560,000 kilowatt-hours. Expressed per tonne of product that is 312 kilowatt-hours per tonne, which is the number that should be tracked monthly and compared against the band in the table above.
Three practical adjustments move this figure meaningfully. Barrel heating in the melting zone should be minimized once the line is in steady state, because on a properly configured screw the shear energy alone is sufficient to maintain melt temperature and the barrel cooling circuit is more often removing heat than adding it. Idle running with the extruder turning but no feed is a pure loss and should be eliminated by procedure rather than by exhortation. And scheduling energy-intensive campaigns, particularly high-chroma concentrates and high-viscosity engineering carriers, into off-peak tariff periods redistributes consumption without reducing it, which typically trims 0.5 to 1.5 percentage points off the electricity share of total cost in regions with strong peak and valley tariff differentials.
It is worth noting that specific energy consumption is also a diagnostic. A gradual month-on-month rise of 5 to 12 percent at constant recipe and constant throughput is a reliable early indicator of screw element wear, of a partially blocked screen pack, or of a gearbox developing additional friction losses. Plants that trend specific energy consumption on a control chart typically detect wear two to four weeks before it becomes visible in throughput or product quality, which converts an unplanned stoppage into a planned one.
Wear Parts, Maintenance Rhythm and the Tonnage Cost of Downtime
Wear in a masterbatch extruder is not a maintenance topic; it is a throughput topic that presents itself as a maintenance topic. Pigment and filler are abrasive, and titanium dioxide, calcium carbonate, talc and carbon black at high loading all attack the screw element flight tips and the barrel liner bore. As the radial clearance grows, conveying efficiency drops, the fill level in the kneading zones changes, dispersion degrades, and specific energy consumption climbs. The plant usually notices the throughput loss long after the margin has already leaked away.
Table 7: Wear part life and its effect on line performance
| Wear item | Typical service life | Symptom of end of life | Performance penalty before replacement |
|---|---|---|---|
| Screw elements, nitrided or standard tool steel | 4,000 to 8,000 operating hours | Radial clearance growth, throughput drop, energy rise | Throughput minus 3 to 8 percent, specific energy plus 5 to 12 percent |
| Screw elements, powder metallurgy grade | 12,000 to 25,000 operating hours | Same symptoms, much later onset | Same penalty band but over a far longer interval |
| Barrel liner, standard bimetallic | 6,000 to 12,000 operating hours | Bore oversize, loss of dispersive shear, pressure instability | Dispersion quality decline, filter pressure value rise |
| Barrel liner, powder metallurgy grade | 15,000 to 30,000 operating hours | Same symptoms, much later onset | Same penalty band over a far longer interval |
| Screen pack in screen changer | 4 to 24 operating hours, or by pressure differential | Pressure differential rise of 3 to 5 megapascal | Feed rate reduction, char release risk, black speck risk |
| Pelletizer knives and bed knife | 400 to 1,200 operating hours | Tails, fines, irregular pellet length | Pellet weight scatter, fines generation, re-screening load |
| Gearbox oil and filters | 4,000 to 6,000 operating hours | Oil analysis metal content, temperature rise | Efficiency loss, risk of unplanned major stoppage |
Converting one hour of downtime into kilograms
The most useful discipline a masterbatch plant can adopt is to express every stoppage in kilograms rather than in minutes, because kilograms are what the plant sells. The conversion is immediate: one hour of downtime on a line rated at 300 kilograms per hour forfeits 300 kilograms of saleable output; on a 500 kilograms per hour line, 500 kilograms; on an 800 kilograms per hour line, 800 kilograms; and on a 1,200 kilograms per hour line, 1,200 kilograms. Over a year, a chronic pattern of one unplanned hour per day on a 500 kilograms per hour line removes 165 tonnes from the plant, which on a 3,000 tonne operation is 5.5 percent of the entire annual output.
Expressed this way, maintenance decisions become simple to evaluate without any monetary calculation. If replacing a set of standard screw elements with powder metallurgy elements extends the interval from 6,000 to 18,000 hours, the plant eliminates two mechanical rebuilds over that period. Each rebuild costs roughly 8 to 16 hours of downtime, so the change recovers 16 to 32 hours of production, equal to 8 to 16 tonnes on a 500 kilograms per hour line. More importantly it eliminates two extended periods of degraded performance in the run-up to each rebuild, during which throughput sits 3 to 8 percent below nominal and specific energy consumption sits 5 to 12 percent above target.
The screen pack rhythm deserves particular attention in color masterbatch because it sits at the intersection of maintenance and quality. Changing screens on a fixed time schedule is inferior to changing them on a pressure differential threshold, because the correct interval depends heavily on the pigment package. A clean organic pigment concentrate may run 20 hours between changes, while a recycled-carrier black masterbatch may need a change every 4 hours. Setting a threshold of 3 to 5 megapascal differential rise and acting on it consistently prevents the char release that generates black specks, and a continuous screen changer removes the stoppage from the equation entirely for plants where changeover frequency is already the binding constraint.
Machine builders differ in how they approach wear management. Kerke offers computer-aided designed screw assemblies with a self-cleaning kneading co-type geometry and full element interchangeability, so a worn dispersive zone can be renewed without replacing the whole assembly. European builders such as Coperion and Leistritz have long promoted high specific torque architectures with segmented barrels and replaceable liners for the same reason. Regardless of supplier, the principle is identical: the wear parts must be modular, and the plant must track their hours, because an unmonitored wear part is a silent throughput tax.
Product Mix and the Gross Margin Gradient
Two masterbatch plants with identical extruders, identical OEE and identical cost structures can post entirely different annual profits because they sell different products. The gross margin gradient in masterbatch is steep, and it tracks technical difficulty almost perfectly. The harder the product is to make consistently, the fewer competitors can make it, and the more of the value the producer retains.
Table 8: Product category, technical difficulty and gross margin grade
| Product category | Technical difficulty | Dispersion demand | Certification burden | Gross margin grade |
|---|---|---|---|---|
| Universal white masterbatch with titanium dioxide | Low | Moderate, high loading but easy dispersion | Low, unless food contact | Low to Medium |
| Universal black masterbatch with carbon black | Low to Medium | High shear needed for high structure grades | Low | Low to Medium |
| Filler masterbatch with calcium carbonate | Low | Distributive rather than dispersive | Low | Low |
| Custom color masterbatch, matched to customer standard | Medium to High | High, filter pressure value critical | Medium | Medium to High |
| Textile and fiber masterbatch, fine denier | High | Very high, filter pressure value at or below 0.5 | Medium to High | High |
| Flame retardant masterbatch | High | High, with thermal sensitivity constraints | High, flammability rating verification | High to Very High |
| Antibacterial masterbatch | High | High, uniform distribution of active agent | High, efficacy testing required | High to Very High |
| Ultraviolet stabilizer masterbatch | Medium to High | Medium to high | Medium, weathering test data | High |
| Conductive and antistatic masterbatch | Very High | Very high, percolation network control | High, resistivity verification | Very High |
| Pearlescent and metallic effect masterbatch | Very High | Low shear required to protect flake geometry | Medium | Very High |
| Food contact certified masterbatch under EU 10/2011 | High | High, plus migration control | Very High, documented compliance chain | Premium |
| Medical grade masterbatch | Very High | Very high, plus contamination control | Very High, biocompatibility and traceability | Premium |
Why the gradient exists
The gradient is not arbitrary. Universal white, black and filler masterbatch are commodity products with transparent specifications, large lot sizes and many capable suppliers, so the margin compresses toward the cost of conversion. They do, however, contribute something valuable that the table does not show: they run in long campaigns, they change color rarely, and they therefore carry a high OEE and dilute fixed cost across the whole plant. Many well-run masterbatch operations deliberately keep a base load of commodity grades to hold the lines full, and layer the higher-margin specialties on top.
Custom color and fiber masterbatch sit in the middle because they demand real dispersion competence and real color matching capability, both of which take years to build. The filter pressure value discipline described in section four is the technical entry ticket to this tier. Functional masterbatch, which includes flame retardant, antibacterial, ultraviolet stabilized, conductive and pearlescent grades, sits higher still because the producer must guarantee a functional property as well as a color, and because the formulation know-how is genuinely scarce. Conductive masterbatch in particular requires control of a percolation network, where the resistivity can swing by orders of magnitude with small changes in shear history, which is precisely the kind of process sensitivity that keeps competitors out.
Certified food contact and medical grades occupy the Premium tier for a reason that has little to do with the extruder. The producer must maintain a documented compliance chain covering every raw material, a controlled production environment, batch traceability, and periodic migration or biocompatibility testing under EU 10/2011 and the applicable national food contact rules. That administrative and quality infrastructure is a fixed investment in capability, and once it exists it is defensible. Plants that make the transition from custom color into certified grades typically report that the technical processing changes were modest while the documentation and cleanliness changes were substantial.
The practical implication for annual profit planning is that product mix should be managed as an engineering portfolio. A plant that is 90 percent commodity is a volume business with a thin margin per tonne and a heavy dependence on OEE. A plant that is 90 percent specialty carries an excellent margin grade per tonne but suffers heavy changeover loss and low OEE because specialty lots are small. The best annual profit outcomes in the installed base usually come from a deliberate blend, roughly half commodity base load running on dedicated lines with long campaigns, and half specialty running on a flexible line configured for rapid changeover.
Three Annual Output Scenarios: 2,000 t, 5,000 t and 10,000 t
The three scenarios below normalize everything to index points so that plants of different sizes can be compared without any currency. In each scenario, revenue is set at 100 index points, and every cost element is expressed as a share of that revenue baseline. Operating profit is what remains. The scenarios assume an identical product mix, an identical average grade positioning, and identical regional conditions, so that the only differences are scale, capacity utilization and the OEE that a larger, better-loaded operation can sustain.
Scenario assumptions
- Scenario A, 2,000 tonnes per year. Two compounding lines in the 300 to 500 kilograms per hour class, capacity utilization about 62 percent, OEE about 74 percent, high share of small custom color lots, 6 to 8 changeovers per day, largely manual packing, one shared quality laboratory.
- Scenario B, 5,000 tonnes per year. Four compounding lines with one dedicated to white and black base load, capacity utilization about 78 percent, OEE about 81 percent, partially grouped color scheduling, 4 to 6 changeovers per day, semi-automatic packing on the base-load line.
- Scenario C, 10,000 tonnes per year. Seven compounding lines with two dedicated base-load lines and one dedicated functional masterbatch line, capacity utilization about 86 percent, OEE about 86 percent, disciplined color family scheduling, 3 to 5 changeovers per day on the flexible lines, automatic packing and palletizing.
Table 9: Three annual output scenarios compared on a revenue baseline of 100 index points
| Item | Scenario A: 2,000 t/yr | Scenario B: 5,000 t/yr | Scenario C: 10,000 t/yr |
|---|---|---|---|
| Capacity utilization | 62 percent | 78 percent | 86 percent |
| Overall equipment effectiveness | 74 percent | 81 percent | 86 percent |
| Annual output loss to color changeover | 4.5 to 6 percent | 3 to 4 percent | 1.5 to 2.5 percent |
| Revenue baseline | 100.0 index points | 100.0 index points | 100.0 index points |
| Variable cost: raw material, energy, packaging, variable labor | 74.0 index points | 73.0 index points | 71.5 index points |
| Fixed cost: depreciation, fixed labor, maintenance base, overhead | 20.5 index points | 15.0 index points | 11.5 index points |
| Total cost | 94.5 index points | 88.0 index points | 83.0 index points |
| Operating profit per 100 index points of revenue | 5.5 index points | 12.0 index points | 17.0 index points |
| Unit profit index, Scenario A equals 100 | 100 | 218 | 309 |
| Total annual profit index, Scenario A equals 100 | 100 | 545 | 1,545 |
Reading the scenario table correctly
Three findings emerge, and each has a direct operational consequence.
First, the variable cost line barely moves. It falls only from 74.0 to 71.5 index points across a fivefold increase in output. That 2.5 index point improvement comes from three sources: better purchasing terms on bulk pigment and carrier, lower purge and scrap because the larger plant can run longer campaigns and dedicate lines, and better specific energy consumption from operating equipment closer to its design point. What it does not come from is any dramatic scale effect on the raw material itself, because pigment and carrier consumption per tonne of product is set by the formulation, not by the plant size. Compounders who expect volume growth alone to solve a materials problem are consistently disappointed.
Second, the fixed cost line moves dramatically, from 20.5 index points down to 11.5 index points. This is the entire mechanism behind the profit gap. Depreciation, the plant management team, the quality laboratory, the maintenance base load and the plant overhead do not scale proportionally with tonnage. Spreading them over five times as many tonnes cuts their per-tonne weight roughly in half. Notice too that Scenario A carries a fixed cost penalty from low capacity utilization as well as from small scale, and that these two effects compound: the small plant has both a higher fixed cost base per tonne of installed capacity and a lower fraction of that capacity converted into saleable output.
Third, the total annual profit index tells a more dramatic story than the unit profit index, and the difference matters for planning. Per tonne, Scenario C earns roughly three times what Scenario A earns. In total, because the tonnage is also five times larger, it earns roughly fifteen times as much. This nonlinearity is why the middle scenario is often the most difficult position in the industry: a 5,000 tonne plant has already lost the flexibility and low overhead of a small custom color house but has not yet reached the fixed cost dilution of a large producer. Plants at that scale generally improve their position faster by upgrading product mix into the High and Very High margin grades than by chasing incremental tonnage in commodity grades.
One caution about the scenario table. It assumes the same average product grade in all three cases. In reality, small custom color houses often sell into higher margin grades than large volume producers, which partly offsets their fixed cost disadvantage. A 2,000 tonne plant that runs 60 percent functional and certified masterbatch can post a higher operating profit index than the table suggests, and in some cases can approach the 5,000 tonne commodity plant. The engineering conclusion is unchanged: within any given product mix, output and OEE dominate, and across product mixes, the margin grade dominates. A plant should decide explicitly which of the two levers it is pulling.
Twelve Actionable Measures That Move the Profit Index
The following twelve measures are drawn from operating improvements observed on masterbatch compounding lines in the field. None requires replacing the extruder, and most can be implemented within one to two quarters. They are ordered roughly by the ratio of effect to effort, so a plant starting an improvement program can work from the top down.
Table 10: Twelve profit measures, mechanism, expected effect and implementation difficulty
| Measure | Engineering mechanism | Expected effect | Implementation difficulty |
|---|---|---|---|
| 1. Color family production sequencing | Groups orders by hue family and runs light to dark, converting most transitions into low-purge transitions | Changeover loss from 2 to 6 percent down to 1 to 2 percent of annual output | Low |
| 2. On-line color difference monitoring | In-line or at-line spectrophotometry detects color drift in 2 to 5 minutes instead of 20 to 40 minutes in the laboratory | Off-color scrap reduced 20 to 40 percent; quality rate up 0.5 to 1.5 points | Medium |
| 3. Loss-in-weight feeder calibration cycle | Weekly load cell verification and monthly metering screw clearance check hold feed accuracy at plus or minus 0.5 percent | Color strength variation reduced; pigment overdosing margin cut 0.5 to 1.5 percent | Low |
| 4. Vacuum devolatilization optimization | Vent pressure held at minus 0.08 to minus 0.095 megapascal gauge with correct melt seal upstream | Lower porosity and moisture, improved pellet density and filter pressure value | Low |
| 5. Pellet uniformity through knife speed and strand tension control | Matching pelletizer knife speed to haul-off speed and stabilizing strand tension and cooling | Pellet weight coefficient of variation from 8 to 12 percent down to 3 to 5 percent | Low to Medium |
| 6. Raw material pre-drying discipline | Hygroscopic carriers and moisture-carrying pigments dried below 0.05 percent before compounding | Bubble and silver streak rejects largely eliminated | Low |
| 7. Reclaim reuse ratio ceiling | In-house purge and off-spec reintroduced into dark grades at a controlled ratio, typically 5 to 15 percent, and 0 to 3 percent for light colors | Recovers a large share of purge tonnage without risking color and speck failures | Low |
| 8. Automatic weighing, bagging and palletizing | Removes manual handling from the highest-volume grades | Labor share of total cost from 5 to 9 percent down toward 4 to 6 percent | Medium to High |
| 9. Peak and valley tariff scheduling | Energy-intensive high-viscosity campaigns moved into off-peak tariff windows | Electricity share of total cost reduced 0.5 to 1.5 percentage points | Low |
| 10. Formulation efficiency, including titanium dioxide extension | Improved dispersion, optimized particle size grades, calcined kaolin or hollow-sphere extenders partially replacing titanium dioxide while holding opacity | Raw material share reduced 1.5 to 4 percentage points, subject to opacity and color difference validation | Medium to High |
| 11. Customer structure upgrade | Portfolio shifted from Low and Medium grades toward High and Very High grades | Weighted average margin grade lifts one full band over two to three years | High |
| 12. Certification upgrade to food contact and medical | Documented compliance chain, controlled production area, batch traceability and periodic migration testing | Unlocks the Premium tier for a defined product family | High |
Notes on the harder measures
Measure 10, formulation efficiency, is the largest single lever in absolute terms because it attacks the 68 to 82 percent raw material block, but it is also the measure most likely to backfire if it is implemented without a validation protocol. Partial substitution of titanium dioxide is technically feasible in many applications because a substantial share of the titanium dioxide in a poorly dispersed white masterbatch is not contributing to opacity at all: it is present as agglomerates whose effective scattering surface is far below the theoretical value. Improving dispersion first, then reducing loading, is the correct order. Reducing loading first is how plants end up with a translucent white that fails at the customer. The validation protocol should measure opacity at the customer’s actual film thickness or wall thickness, measure color difference against the approved standard, and measure filter pressure value before and after, and no substitution should be released without all three.
Measure 7, the reclaim reuse ratio ceiling, is worth a specific caution. Purge material and off-spec product represent recoverable tonnage, and a plant that discards all of it is throwing away a meaningful fraction of its raw material block. But reclaim carries accumulated thermal history, unpredictable color content and elevated contamination risk. The workable rule is a strict ceiling by grade: dark and black grades can absorb 10 to 15 percent reclaim without measurable harm, medium colors 5 to 10 percent, light and pastel colors 0 to 3 percent, and certified food contact or medical grades zero. The reclaim must be sorted by color family at the point of generation, not accumulated in a single bin, because unsorted reclaim is only usable in black.
Measure 2, on-line color difference monitoring, changes the economics of a color campaign more than its cost suggests. In a laboratory-only regime, the time between taking a sample and knowing the result is 20 to 40 minutes, during which the line continues to produce. If the result is out of tolerance, that entire production window is suspect. At 500 kilograms per hour, a 30 minute detection lag puts 250 kilograms at risk on every excursion. An at-line spectrophotometer with a rapid pressed-plaque or pellet-view method compresses the lag to 2 to 5 minutes and cuts the material at risk by roughly 85 percent. On a plant running many short color campaigns this single change often produces the largest measurable quality rate improvement of any measure in the list.
Measure 11 and measure 12 are strategic rather than operational, and they take years rather than quarters, but they are the only two measures that change the ceiling rather than the current position. Every other measure in the list moves the plant closer to the best achievable performance within its existing product mix. Upgrading the customer structure and the certification scope moves the plant into a different mix with a structurally higher margin grade. A plant that has already implemented measures 1 through 10 and finds its improvement curve flattening has reached the point where measures 11 and 12 are the remaining path.
Standards That Underpin the Profit Model
Five standards recur throughout this analysis, and each is directly connected to a profit mechanism rather than to paperwork. Understanding that connection is what turns a quality management system from an overhead into a margin instrument.
DIN EN 13900-5 defines the filter pressure value test for pigment dispersion in plastics. It is the objective measure of whether the dispersive mixing section of the twin screw extruder is doing its job. A masterbatch at or below 0.5 bar per gram per square centimeter qualifies for fine-denier fiber and thin film applications; a masterbatch well above that value is confined to thick-wall applications with correspondingly lower margin grades. This standard is therefore the technical gatekeeper of the product tier.
ISO 787 is the general methods series for testing pigments and extenders, covering properties such as residue on sieve, matter volatile at 105 degrees Celsius, water-soluble matter, oil absorption value and relative tinting strength. In a masterbatch plant these tests belong at incoming inspection, because a pigment lot whose oil absorption or tinting strength differs from the previous lot will change both the dispersion behavior and the color strength, generating color difference rejects that appear to be process faults but are in fact raw material variation.
GB/T 24274 is the Chinese national specification for color masterbatch, covering the classification, requirements, test methods, inspection rules and marking of color masterbatch products. It provides the baseline product specification framework for producers serving the Chinese market and for exporters whose customers reference it, and it aligns the definition of key indicators such as pigment content, moisture and dispersion so that supplier and customer measure the same thing the same way.
ASTM D1729 establishes the practice for visual appraisal of colors and color differences of diffusely illuminated opaque materials. Even in plants with modern spectrophotometry, the final release decision on a visible consumer part is often visual, and an uncontrolled viewing environment generates disputes that consume shipment and rework capacity. Standardizing the light booth, the illuminant, the surround and the observer conditions removes a recurring source of avoidable rejection.
EU 10/2011 is the European regulation on plastic materials and articles intended to come into contact with food. It governs the permitted substance list, the migration limits and the documentation chain, and it is the compliance basis for the Premium tier described in section nine. Meeting it requires that every pigment, carrier and additive in the formulation is listed or otherwise permitted, that overall and specific migration limits are verified, and that a declaration of compliance is maintained through the supply chain.
Beyond these five, plants serving specific segments will also work with flammability rating verification for flame retardant grades, resistivity verification for conductive grades, weathering test protocols for ultraviolet stabilizer grades, and biocompatibility and traceability requirements for medical grades. In every case the pattern is the same: the standard defines a measurable property, the measurable property defines the accessible market tier, and the accessible market tier defines the margin grade.
Frequently Asked Questions
What overall equipment effectiveness should a color masterbatch plant target?
A realistic industry band is 72 to 88 percent, built from availability of 85 to 93 percent, performance rate of 88 to 96 percent and quality rate of 96 to 99.5 percent. Plants running many small color lots sit at the lower end because changeovers consume availability, while dedicated white or black masterbatch lines with long campaigns reach the upper end. The correct target is not a universal number but the best achievable value for the plant’s actual lot size distribution, and the fastest route to it is almost always availability improvement through production sequencing rather than performance rate improvement through faster running.
How much annual output do color changeovers actually consume?
Each changeover discharges roughly 8 to 30 kilograms of purge material, and a typical custom color plant performs 3 to 8 changeovers per day. Adding the stoppage time of 15 to 60 minutes per changeover, the total removes about 2 to 6 percent of annual output. On a 500 kilograms per hour line performing 6 changeovers per day with 40 minutes of stoppage each, the time component alone forfeits about 660 tonnes per year. Grouping orders by color family and sequencing light to dark reduces the total loss to about 1 to 2 percent.
What specific energy consumption is realistic for color masterbatch on a twin screw extruder?
Color masterbatch typically consumes 0.18 to 0.32 kilowatt-hours per kilogram at the main drive, with high-chroma organic pigment concentrates at the top of that band and white masterbatch toward the bottom. Highly filled calcium carbonate filler masterbatch runs at 0.12 to 0.22 kilowatt-hours per kilogram. Auxiliary equipment adds 20 to 30 percent on top, and idle running during changeovers adds a further 3 to 6 percent. A plant should track kilowatt-hours per tonne monthly, because a 5 to 12 percent drift at constant recipe is an early wear signal.
How does filter pressure value influence profitability?
Filter pressure value measured according to DIN EN 13900-5 quantifies how much undispersed pigment agglomerate remains in the product. A premium color masterbatch holds it at or below 0.5 bar per gram per square centimeter, which allows the customer to run higher letdown ratios, finer melt filters and thinner films without blockage. Because that capability is what qualifies a masterbatch for fine-denier fiber and thin film markets, filter pressure value is effectively the technical entry ticket to the High, Very High and Premium margin grades. Two plants with identical extruders can occupy different margin tiers purely on this metric.
Do powder metallurgy screw elements and barrel liners pay back?
Standard nitrided or tool steel elements typically last 4,000 to 8,000 operating hours in abrasive pigment and filler service, while powder metallurgy elements reach 12,000 to 25,000 hours and powder metallurgy barrel liners 15,000 to 30,000 hours. The payback comes from three places at once: fewer rebuild stoppages, elimination of the extended degraded-performance period before each rebuild during which throughput sits 3 to 8 percent low and specific energy consumption sits 5 to 12 percent high, and more stable dispersion because the radial clearance stays within design. For plants running titanium dioxide, calcium carbonate or glass fiber the upgrade is normally justified on throughput alone.
Which color masterbatch product category delivers the highest gross margin grade?
Gross margin follows technical difficulty. Universal white and black masterbatch and calcium carbonate filler masterbatch sit at Low to Medium, custom color masterbatch at Medium to High, textile and fiber masterbatch at High, functional grades such as flame retardant, antibacterial, ultraviolet stabilized, conductive and pearlescent at High to Very High, and certified food contact and medical grades at Premium. The practical strategy for most plants is a blend: commodity base load on dedicated lines to hold OEE and dilute fixed cost, with specialty grades layered onto a flexible line configured for rapid changeover.
How much does annual profit improve when output rises from 2,000 tonnes to 10,000 tonnes?
On a like-for-like product mix, unit fixed cost falls from about 20.5 index points of revenue at 2,000 tonnes to about 11.5 index points at 10,000 tonnes, while variable cost falls only from 74.0 to 71.5 index points. Operating profit therefore rises from roughly 5.5 to 17.0 index points per 100 index points of revenue, a unit profit index of 309 against a baseline of 100. Because the tonnage also multiplies fivefold, the total annual profit index grows to roughly 1,545. Almost the entire gain is fixed cost dilution, which is why OEE improvement behaves like a scale increase.
What is the single biggest profit lever in a color masterbatch plant?
Raw material efficiency, because pigment, carrier and additives together are 68 to 82 percent of total cost. A one percent relative reduction in raw material consumption moves total cost by 0.68 to 0.82 percentage points, which is roughly what an entire successful energy efficiency program delivers. In practice the largest accessible gains come from reducing off-color scrap through faster color difference detection, reducing purge tonnage through color family sequencing, and reducing pigment overdosing margin through disciplined loss-in-weight feeder calibration. Overall equipment effectiveness is the second lever, because it multiplies the tonnage over which every fixed cost is spread.
Conclusion
The annual profit of a color masterbatch operation is an engineering output. It is produced by overall equipment effectiveness in the 72 to 88 percent band, by color changeover loss held between 1 and 2 percent rather than allowed to run at 4 to 6 percent, by filter pressure value at or below 0.5 bar per gram per square centimeter that qualifies the product for the higher margin tiers, by specific energy consumption held inside the 0.18 to 0.32 kilowatt-hours per kilogram band, by wear parts whose hours are tracked and replaced on condition rather than after the throughput has already fallen, and by a product mix that is managed deliberately across the Low to Premium margin gradient.
The scenario analysis makes the priority explicit. Moving from 2,000 to 10,000 tonnes per year lifts operating profit from about 5.5 to about 17.0 index points per 100 index points of revenue, and nearly all of that gain comes from diluting fixed cost rather than from cutting variable cost. Since OEE improvement raises tonnage without raising the fixed cost base, every point of OEE behaves exactly like a point of scale. For a plant that cannot grow its order book quickly, OEE is therefore the most direct available substitute for growth, and it costs nothing but discipline in scheduling, calibration and maintenance.
For compounders planning or reviewing a masterbatch operation in 2026, the sequence that produces results is consistent across the installed base: first fix scheduling and changeover discipline, because it is free and it recovers whole percentage points of annual tonnage; then fix measurement, because on-line color difference detection and specific energy consumption trending prevent losses before they accumulate; then fix wear management, because unmonitored wear parts silently tax throughput; then attack formulation efficiency with a proper validation protocol; and only then consider strategic moves into higher certification tiers.
Kerke, a Wanplas factory with more than 12 years of specialization in co-rotating parallel twin screw compounding extruders, supports masterbatch producers on exactly these operating parameters. The KTE series, from the KTE-16B laboratory machine used for formulation trials up to the KTE-135D production machine, is built with optimizable length-to-diameter ratio, modular barrel structure, configurable screw arrangement, tailored devolatilization and matched feeding systems, which are precisely the variables that determine dispersion quality, specific energy consumption and changeover behavior in daily production. Under the Wanplas brand, whose network of specialized factories shares common quality standards and technical support practices, Kerke works with compounders to configure the screw and the auxiliary package around the actual product mix rather than around a catalog specification, because in masterbatch that configuration is where the annual profit is decided.